I ran into some problem when I copy tensor from cuda to cpu
if copy it directly, it is very fast
# b shape < 1, 3, 32,32 >
b = Variable(torch.randn(1,3,32,32).cuda())
t1 = time.time()
c = output.cpu().data.numpy()
t2 = time.time()
print(t2-t1)
# time cost is about 0.0005s
however, if I forward some input to a net then copy the output to the cpu, it can be extremely slow
a = Variable(torch.FloatTensor(1,3,512,512).cuda())
# output shape < 1, 3, 32, 32>
output = net(a)
t1 = time.time()
c = output.cpu().data.numpy()
t2 = time.time()
print(t2-t1)
# time cost is about 0.02
@ptrblck Hello~ torch.cuda.synchronize() guarantees us to count the “real time” of each operation when we analyze the time consumption. Furthermore, will it slow down the training process when used in training code?
I got the same problem. I test same step in V100 and P100 card.
On V100 card machine, the .cpu() cost less than 0.01s.
But on P100 card machine, this step cost 5 second at most! @ptrblck is that only about the GPU? the pytorch version and Cuda version are both same: CUDA 9 and pytorch 1.0.0
Sorry for not being clear enough. If you just want to time the CPU transfer time, call torch.cuda.synchronize() before starting and stopping the timer.
In your current code snippet you are starting the timer (, while potentially the some asynchronous CUDA calls are processed) then synchronizing, which will add the time of potential CUDA operations to the cpu() call.
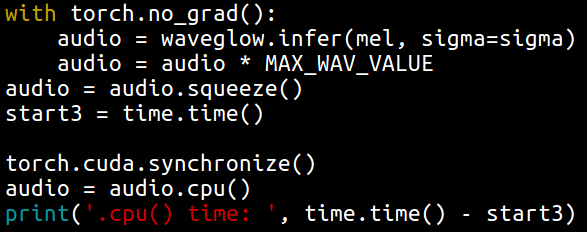
To time the transfer time alone, use this:
# some operations
torch.cuda.synchronize()
start = time.time()
audio = audio.cpu()
torch.cuda.synchronize()
end = time.time()
Oh sorry I didn’t notice that.
Thanks for your patient explain!
After add synchronize() before count the time.
I found It’s indeed the synchronizing step consume the time.
I just want make sure is it normal that the V100 is faster so much than P100 on fp16 inference?
After add synchronizing time, As the result, the speed of V100 is about 20x faster than P100.
If not, what may be the problem?
Yes, a speedup for FP16 is expected, as the V100 uses TensorCores for the computation of FP16 data (if possible). Usually you could expect a 2x speedup for some operations like GEMM and convolutions. The 20x speedup is quite high, but might come from a combination of accelerated ops (e.g. if you are also using a stronger CPU, faster data access etc.).
I’ve checked 2 machine(p100 vs V100), # of cpu core are 16 vs 56, memory: 120G vs 500G
I am not familiar with hardware effect.
Do you think this can explain for the high speed difference?
It also depends on the CPU, RAM type etc., but based on these information it looks like the second machine (with V100) is quite bulkier than the first one, so I would expect to see some speedup.
Note that the speedup depends on a lot of factors (e.g. where the bottleneck in the computation is), but 20x seems reasonable.
Thanks for the quick reply. I lost one important information:
I’ve test speed of another model(tacotron2 of nvidia, not fp16 model) on this 2 machine.
The speed of these 2 machine: 0.12 vs 0.15 (real time factor) the V100 machine only faster a little bit.
So I feel weird the speed diff so much for the waveglow model inference.
That’s what I was referring to.
You can expect bigger speedups, if you use the TensorCores in your V100 (FP16 ops, shapes of multiples of 8 for GEMMs), while other use cases might give a lower speedup or in the worst case none at all, if the bottleneck is e.g. the data loading.
If you are using some heavy preprocessing and data loading, this might create the major botteneck in your code. While the V100 could still be faster than the P100 in the training loop, both would have to wait for the next batch to be ready, so that the performance benefit of your V100 will be hidden in the waiting time.
I run my code on the CPU and then convert it to run on the GPU. On the GPU I face some error because of the type of variables. for example it expect the double but it received float. Then I solve the error but why it happen? Because in teh CPU i never see these errors?
You should see the same errors also on the CPU.
If that’s not the case, could you check the dtypes explicitly and if the mismatch doesn’t cause an error on the CPU, post a reproducible code snippet, so that we could have a look, please?
Hello, I am trying to run my model on an Xavier NX. It seems to take about 17 seconds to copy a torch tensor of size (320 x 480), dtype: torch.uint8 to the host memory. Any suggestion to deal with this bottleneck would be helpful. Code snippet:
 with torch.no_grad():
            a = model(img)    # a['out'] >> torch.float32; size: [1 x 1 x 320 x 480]; no Grad; on CUDA
result_gpu = (a['out'][0][0] > 0.1).type(torch.uint8) # result_gpu >> torch.uint8; size: [320 x 480]; no Grad; on CUDA
start = time.time()
result_cpu = result_gpu.cpu()
end = time.time()
print(end - start)   # 17.0668951