I have trained resnet for cats and dogs classification and I want to find influence of my input image on an output neuron. So basically I want to calculate the gradients of an output neuron with respect to my Input Image pixels and plot it.
Here is my code:
filename = 'cat1.jpg'
img_path=filename
img1=Image.open(img_path)
img1_trans=transform_test(img1)
img1_trans_reshaped=img1_trans.view(-1,3,224,224)
img1_trans_reshaped.requires_grad = True
loaded_model.zero_grad()
out=loaded_model(img1_trans_reshaped.to(device))
out_softmax=F.softmax(out,1)
cat_pred = out_softmax[0][0]
cat_pred.backward()

print(img1_trans_reshaped.grad)
Output:
tensor([[[[-1.3364e-06, -5.2334e-06,  5.1713e-06,  ...,  1.8244e-06,
            8.3905e-07,  6.2033e-08],
          [ 1.4356e-06,  5.3804e-06,  6.9018e-06,  ...,  2.3469e-06,
            1.6533e-06,  8.5997e-07],
          [ 1.7546e-06,  6.7261e-06,  9.5721e-06,  ...,  3.1108e-06,
            1.3452e-06, -5.1059e-07],
          ...,
          [-2.9010e-06, -1.3555e-06, -3.0110e-06,  ...,  3.1977e-06,
            4.3654e-07,  4.9908e-07],
          [-4.5805e-07,  3.9601e-07, -1.5127e-07,  ..., -4.6478e-06,
           -5.3948e-07, -2.9176e-07],
          [-1.8832e-07,  4.0093e-07,  7.5335e-07,  ..., -2.8801e-06,
           -5.7174e-07, -4.8546e-07]],

         [[-2.2643e-06, -1.6474e-05, -1.0758e-05,  ...,  2.2963e-08,
            6.6204e-07,  1.1025e-06],
          [-2.3806e-06, -9.6780e-06, -1.3786e-05,  ...,  1.0190e-06,
            5.3521e-07,  1.1829e-06],
          [-3.1714e-06, -4.3120e-06, -1.5044e-06,  ...,  3.4984e-06,
            4.1726e-07,  3.0026e-08],
          ...,
          [-2.1173e-06, -7.8263e-07, -3.0821e-06,  ...,  9.0360e-07,
            2.2781e-06,  1.0548e-06],
          [-2.9051e-06, -2.0635e-06, -2.0461e-06,  ..., -5.9555e-06,
            1.8820e-08,  5.4577e-07],
          [-2.6363e-06, -2.6411e-06, -2.4415e-06,  ..., -4.0045e-06,
            1.8379e-07,  7.2929e-07]],

         [[ 3.9555e-06, -3.2382e-06,  6.2518e-06,  ..., -2.3060e-06,
           -1.7080e-06, -6.6353e-07],
          [ 2.0825e-06, -5.3293e-07,  2.6019e-06,  ..., -3.8364e-06,
           -2.7159e-06, -1.1808e-06],
          [ 3.9900e-06,  5.5322e-06,  1.2469e-05,  ..., -3.3086e-06,
           -1.7644e-06, -8.0982e-07],
          ...,
          [ 1.2471e-06,  3.5633e-06,  2.3334e-06,  ..., -2.7266e-07,
            1.2923e-06,  3.7251e-07],
          [ 7.1651e-07,  1.4539e-06,  6.9380e-07,  ..., -2.0640e-06,
            9.8504e-07,  8.3394e-07],
          [ 1.1249e-06,  8.9951e-07, -7.4418e-07,  ..., -6.5628e-07,
            1.5230e-06,  1.1797e-06]]]]
As you can see the gradients are very small close to zero ,
and after plotting it I get a complete black image:
But what I want is an Image of this kind as shown in this video https://youtu.be/SPJnlFtw6h0 :
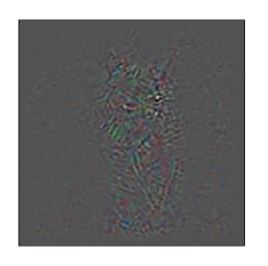
Please tell me where I am going wrong and how to get the expected output