Hello
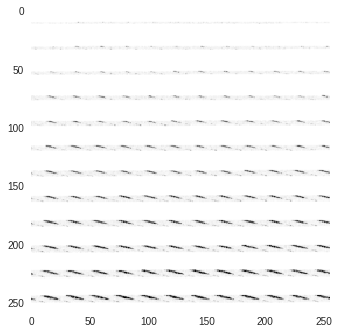
i am trying to plot Nifty format in pytorch after passing them to the loader but i am getting wrong image , code and image shown below
class Dataloder_img(data.Dataset):
    def __init__(self,root_dir,seg_dir,transforms ):
        self.root_dir = root_dir
        self.seg_dir = seg_dir
        self.transforms = transforms
        self.files = os.listdir(self.root_dir)
        self.lables = os.listdir(self.seg_dir)
        print(self.files)

    def __len__(self):
        return len(self.files)

    def __getitem__(self,idx):
        img_name = self.files[idx]
        label_name = self.lables[idx]
        img = nib.load(os.path.join(self.root_dir,img_name)) #!Image.open(os.path.join(self.root_dir,img_name))
        #change to numpy
        img = np.array(img.dataobj)
        #change to PIL
        img = Image.fromarray(img.astype('uint8'), 'RGB')

        print(img.size)

        label = nib.load(os.path.join(self.seg_dir,label_name))#!Image.open(os.path.join(self.seg_dir,label_name))
        #change to numpy
        label = np.array(label.dataobj)
        #change to PIL
        label = Image.fromarray(label.astype('uint8'), 'RGB')

        print(label.size)

        if self.transforms:
            img = self.transforms(img)
            label = self.transforms(label)
            return img,label
        else:
            return img, label
full_dataset = Dataloder_img('/``imageTr',
                                     '/``/labelTr',tfms.Compose([tfms.RandomRotation(0),tfms.Resize((256,256)),tfms.ToTensor()
                                                            ]))#


train_size = int(0.8 * len(full_dataset))
val_size = len(full_dataset) - train_size
train_dataset, val_dataset = torch.utils.data.random_split(full_dataset, [train_size, val_size])
train_loader = data.DataLoader(train_dataset,shuffle=False,batch_size=bs)
val_loader = data.DataLoader(val_dataset,shuffle=False,batch_size=bs)
import matplotlib as mpl
mpl.rcParams['axes.grid'] = False
test_img, test_lb = next(iter(full_dataset))
print(test_img[0].shape)
plt.imshow(test_lb[0])