path=glob.glob('............./*.wav')
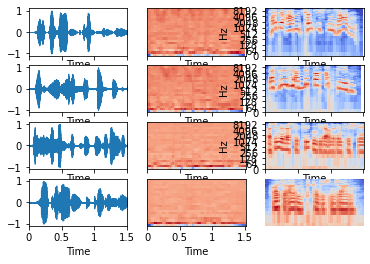
fig, ax = plt.subplots(nrows=4, ncols=3, sharex=True)
for i in range(4) :
y, sr = librosa.load(path[i], sr=16000)
plt.axis('off')
librosa.display.waveplot(y, sr, ax=ax[i, 0]) # put wave in row i, column 0
mfcc=librosa.feature.mfcc(y)
plt.axis('off')
librosa.display.specshow(mfcc, x_axis='time', ax=ax[i, 1]) # mfcc in row i, column 1
S = librosa.feature.melspectrogram(y, sr)
plt.axis('off')
librosa.display.specshow(librosa.power_to_db(S), x_axis='time', y_axis='log', ax=ax[i, 2]) # spectrogram in row i, column 2
I tried different positions for plt.axis(off) But none is working only on the last plot it’s working. any suggestions @ptrblck sir plz help, I know this is out of forum discussion but if you can guide me,
Regards