i am getting this error when i run
test_img, test_lb = next(iter(full_dataset))
print(test_img[0].shape)
print(test_lb[0].shape)

plt.imshow(test_img[0].permute(2,1,0))
my data is in nifty format
i am getting this error when i run
test_img, test_lb = next(iter(full_dataset))
print(test_img[0].shape)
print(test_lb[0].shape)
plt.imshow(test_img[0].permute(2,1,0))
my data is in nifty format
What is the shape of test_img and test_img[0]?
torch.Size([256, 256])
torch.Size([256, 256])
The shapes shouldn’t be the same, if you index the tensor (the second one should be torch.Size([256]) or the first one should have an additional dim0).
Anyway, you cannot permute three axes, if your tensor just has two dimensions.
What is your use case? Are you maybe missing the batch dimension?
@ptrblck think there is something missing in the dataloader
class Dataloder_img(data.Dataset):
    def __init__(self,root_dir,seg_dir,transforms ):
        self.root_dir = '/images'
        self.seg_dir = '/label'
        self.transforms = transforms
        self.files = os.listdir(self.root_dir)
        self.lables = os.listdir(self.seg_dir)
        print(self.files)

    def __len__(self):
        return len(self.files)

    def __getitem__(self,idx):
        img_name = self.files[idx]
        label_name = self.lables[idx]
        img = nib.load(os.path.join(self.root_dir,img_name)) #!Image.open(os.path.join(self.root_dir,img_name))
        #change to numpy
        img = np.array(img.dataobj)
        #change to PIL
        img = Image.fromarray(img.astype('uint8'), 'RGB')

        print(img.size)

        label = nib.load(os.path.join(self.seg_dir,label_name))#!Image.open(os.path.join(self.seg_dir,label_name))
        #change to numpy
        label = np.array(label.dataobj)
        #change to PIL
        label = Image.fromarray(label.astype('uint8'), 'RGB')

        print(label.size)

        if self.transforms:
            img = self.transforms(img)
            label = self.transforms(label)
            return img,label
        else:
            return img, label
i think the part where i convert numpy to PIL is missing something .
The script you’ve posted is a Dataset, not to be confused with a DataLoader.
I guess, you would like to wrap your Dataset into a DataLoader, which will add the batch dimension automatically.
Could you try your code with:
loader = DataLoader(full_dataset, batch_size=10)
test_img, test_lb = next(iter(loader))
plt.imshow(test_img[0].permute(2, 1, 0))
(512, 512)
<matplotlib.image.AxesImage at 0x7fa69a1958d0>
that was the output ,
full_dataset = Dataloder_img('//imageTr',
                                     '//labelTr',tfms.Compose([tfms.RandomRotation(45),tfms.Resize((256,256)),tfms.ToTensor()
                                                            ]))#
even when i show the len of the date set appears as 20 , even though my images are 20 and their label is 20 ,
is not suposed to be 40 ?
No, since each sample will return an image tensor and the corresponding target.
Your Dataset implementation should be right and also defines the length as len(self.files).
but i cannot show the images by :
test_img, test_lb = next(iter(full_dataset))
print(test_img[0].shape)
plt.imshow(test_img[0].permute(2,1,0))
which is my main problem , is it becuase they are nifty fromt
You might need to use a specific Python library for neuro-imaging, e.g. Nilearn.
However, do you get any error message when trying to plot the image using matplotlib?
yes it gives this error
TypeError: ‘Tensor’ object is not callable
Could you post the stack trace as I’m not sure if this type of error is thrown in the plt.imshow() line of code.
Usually this error is raised, if you try to call a tensor like a function:
x = torch.randn(3, 24, 24)
x()
> TypeError: 'Tensor' object is not callable
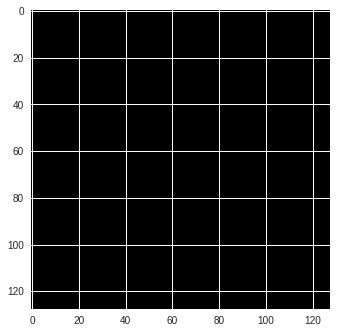
@ptrblck now it is working for training image but it gives me a black image as showing below
<matplotlib.image.AxesImage at 0x7f5eb8ac0588>
[quote=“ptrblck, post:2, topic:38562”]
test_img[0].shape
is [ 3,128,128]
and test_img.shape
is [10,3,128,128]
Try to normalize the values using
x = x - x.min()
x = x / x.max()
If that doesn’t work, could you post the image statistics like min, max, std, and also the histogram if possible?
the statistics of test_img is :
Maximum value in this image 0.7411764860153198
Minimum value in this image 0.0
std value in this image 0.09400026500225067
Did the image change after you’ve normalized it or did it stay black?
It did stay black after the normalization
In that case, have a look at the histogram of your pixel values.
Maybe just a few pixels have a higher value, thus your current visualization can hardly capture it?