I am experiencing a strange loss behavior when I migrated my coded to an RTX2080Ti machine from a Titan XP machine.
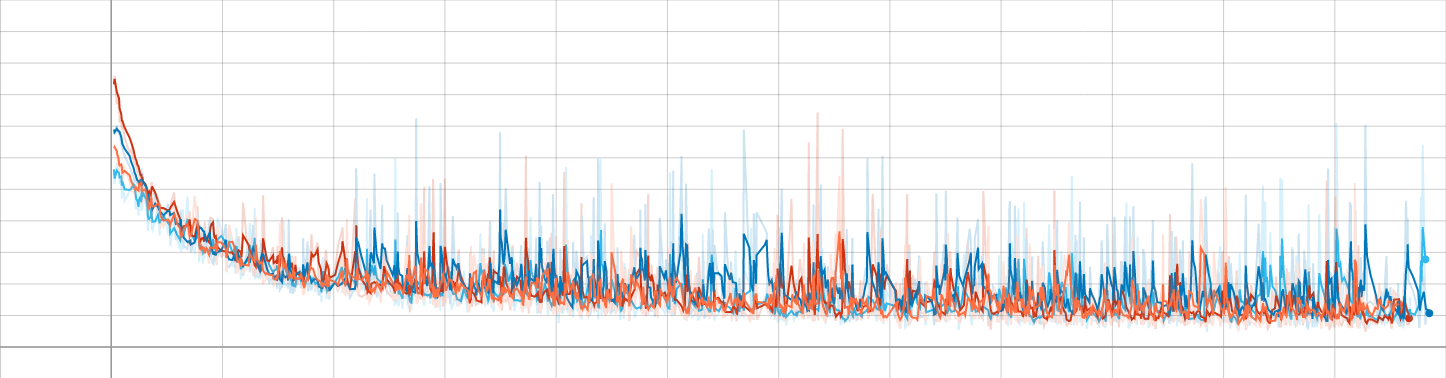
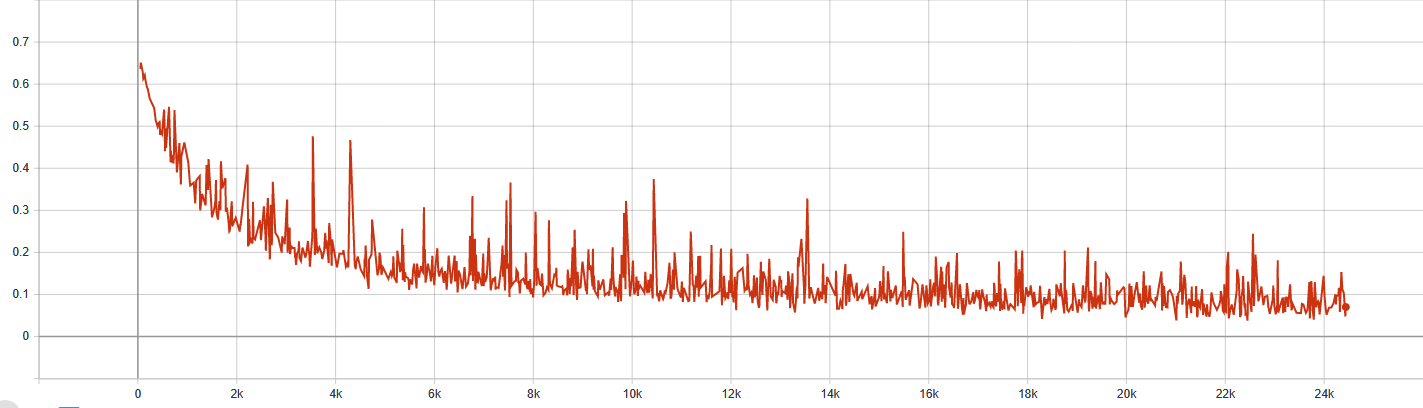
I am getting a large loss fluctuation when the loss is becoming small. I have suspicions that its a precision problem but I didn’t get any under flow error during training.
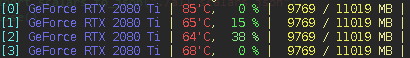
I have read some post about factory bad GPUs but I have tried identical code on 4 separate piece of GPU, they all have similar problems.
Four colors represents different GPUs on RTX2080Ti
However, the validation loss looks fine , can’t upload that due to new users
I am using PyTorch 1.2, Cuda 10.0 from Anaconda3 on an Ubuntu 18.0 machine.
Any comments are welcomed cause this had bothered me for quite some time.
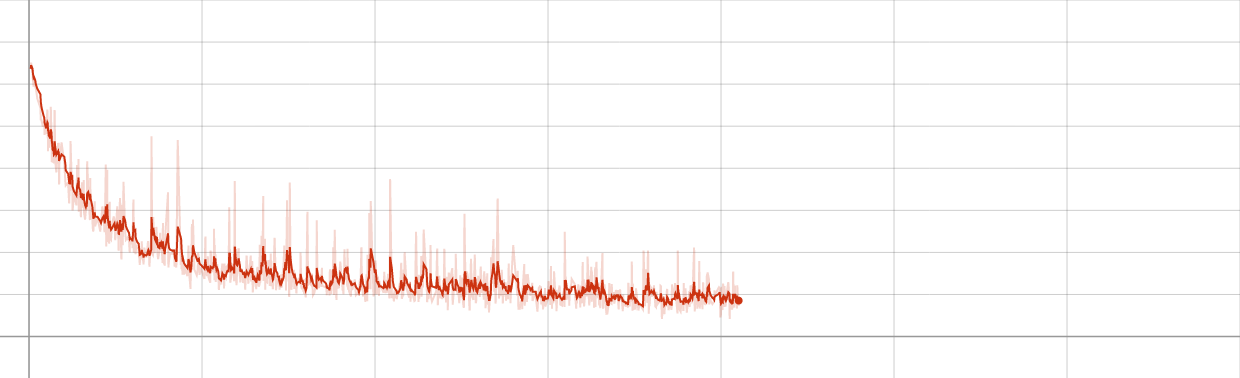
Could you post the loss on your Titan XP?
Are there any other differences regarding the CUDA, cudnn, PyTorch versions between your Titan XP and RTX2080Ti runs?
Yeah, you shouldn’t use older CUDA versions than 10.0 for your RTX2080Ti, but could you rerun the script on your Titan XP using CUDA10.0, cudnn 7.6.2 and PyTorch 1.1?
It would give us an idea, where the difference might come from.
I’m not sure at this point, how to interpret the loss curves.
The blue (good) curve looks like the x-axis is sampled differently.
Especially at the beginning it looks like the step size is not constant and you have some interpolated lines.
Are you using the same step size (e.g. wall time, iterations)?
Also, does the y-axis have the same range in all plots? If the blue line had some really high loss at the beginning, the rest might look smoother as it’s just smaller.
The blue one does have a lot more steps, sorry for not including the steps count
But I think its also clear that the RTX2080Ti run with a lot more fluctuations than Titan Xp.
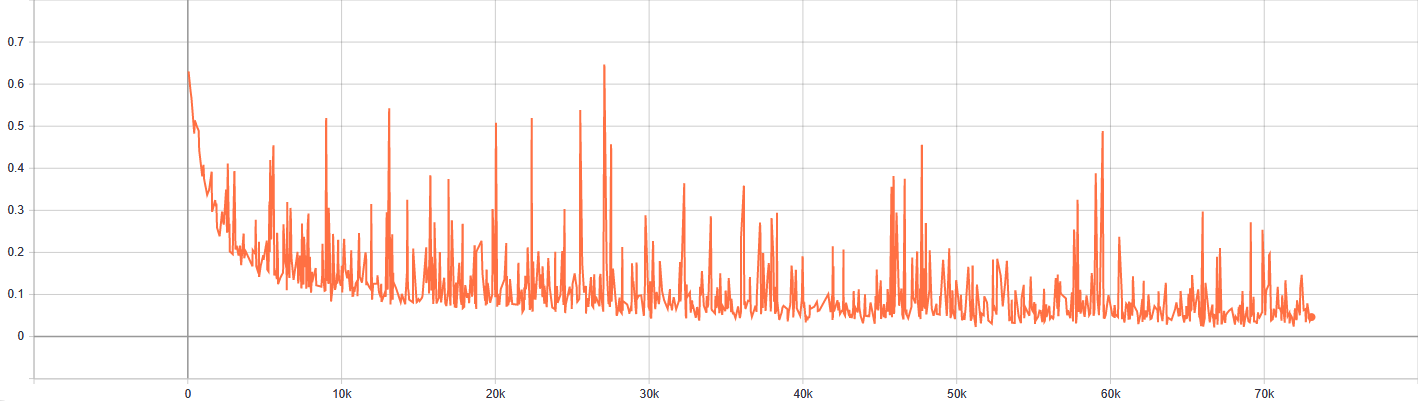
I one of the run from RTX2080Ti and removed the smoothing for comparison.