@moskomule Hi I got this error after run it.
How to fixed this?
You want to upgrade to pytorch 0.2 (for which the used Variable.grad_fn replaces the older and obsolete Variable.creator).
Best regards
Thomas
Does this work as of pytorch v0.2? I tried to run with a simple sequential model and got an empty image
The function wants a Variable, e.g. a module calculation result. That worked for me with 0.2.
@moskomule @tom I tried that script in Resnet18 and it works well. However when I am using my own model it got this error.
How to solve this?
-Thank you-
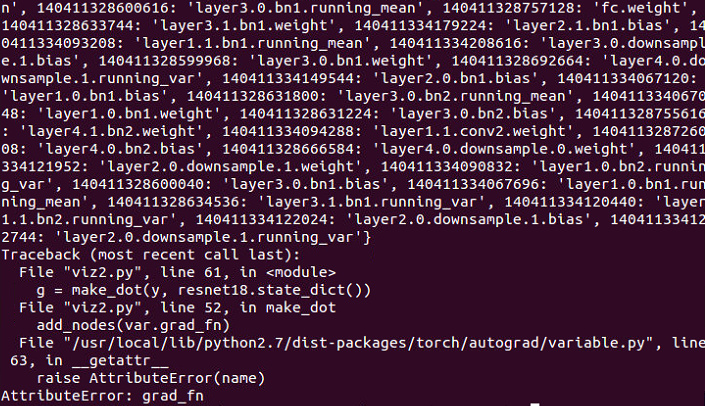
If you don’t have a test case to show, you get to debug it all by yourself.  As the message says, it looks like your
 y is a tuple and not a variable.
With errors like this I usually add print(type(var)) before the statement that throws the exception to debug.
Best regards
Thomas
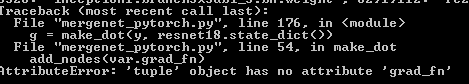
The state_dict is a map from Tensor to name, so I change code get(id(u)) to get(id(u.data)), it works without None in blue boxes.
node_name = '%s\n %s' % (param_map.get(id(u)), size_to_str(u.size()))
Hello, Im getting the following error when trying to visualize the graph with params using python 3.6:
ca3/NN/Image_Classification_Using_NN/NNet.py", line 160, in graph_model
dot = v.make_dot(out,params)
File “/home/diego/Desktop/Universidad/3er Año/1er Semestre/APC/Practica/Practica3/NN/Image_Classification_Using_NN/visualize.py”, line 64, in make_dot
add_nodes(var.grad_fn)
File “/home/diego/Desktop/Universidad/3er Año/1er Semestre/APC/Practica/Practica3/NN/Image_Classification_Using_NN/visualize.py”, line 57, in add_nodes
add_nodes(u[0])
File “/home/diego/Desktop/Universidad/3er Año/1er Semestre/APC/Practica/Practica3/NN/Image_Classification_Using_NN/visualize.py”, line 57, in add_nodes
add_nodes(u[0])
File “/home/diego/Desktop/Universidad/3er Año/1er Semestre/APC/Practica/Practica3/NN/Image_Classification_Using_NN/visualize.py”, line 47, in add_nodes
name = param_map[id(u)] if params is not None else ''
KeyError: 140462544025784
Before calling the function i had to convert all params values to Variables, like so:
for key in params:
     params[key] = Variable(params[key])
Can anyone tell me what am I doing wrong?
Why doesnt the id(u) maps correctly to the one in params?
The script works perfectly fine if i dont give it params btw.
there is no ‘previous_functions’ attribute in var, but has ‘next_functions’, while using the ‘next_functions’ will plot lots of backward nodes, so how can you plot this graph without backward nodes? thanks!
I’d love to know how to implement this in PyTorch 0.4. I’ve spent a little while trying to work out how the new Tensor object relates to the old Variable, and it’s not clear to me. e.g. Tensors don’t have a creator attribute, nor previous_functions.
Any clues how to traverse the graph?
creator has been changed to grad_fn a while ago. You can use that.
You can look at this repo that does it.
Blimey, that was fast. Thank you.
You need to specify the named_parameters in make_dot function
make_dot(model(x), params=dict(model.named_parameters()))
The resource that you are mentioning has been moved to a separate repo and can be found in this link.
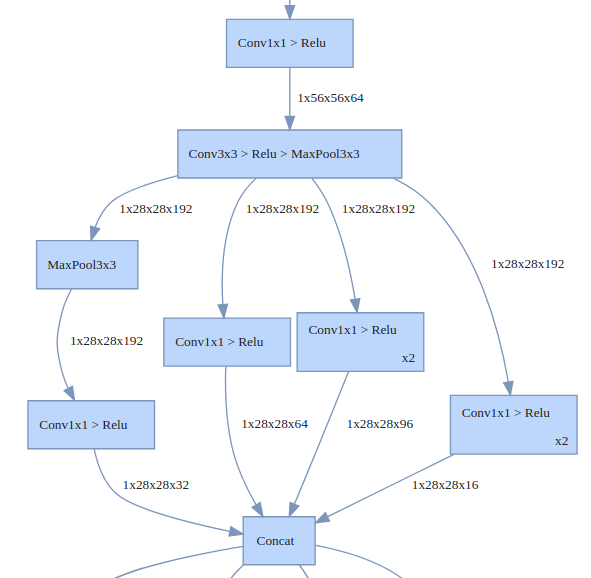
I wrote a tool that might be useful to some of the folks on this thread. In addition to drawing the graph, it simplifies it by merging similar or related nodes together. For example, instead of drawing Conv -> RELU -> MaxPool -> Conv -> RELU -> MaxPool -> …etc., it merges Conv/RELU/MaxPool into one box because they often come together, and it puts a x4 if that whole group repeats 4 times. This simplifies the graph and makes it easier to understand, especially for large networks.
Also you can customize how nodes are grouped. If you want more details, you can draw all the nodes without grouping them. And if you want a high level view, you can fold big parts into one box, such as a ResNet block or an Inception module. Feedback welcome. The library is HiddenLayer
Seems really nice 
looks nice, but is it only possible to plot the model in a jupyter notebook or also to a file?
This application is amazzzzzinng… Thanks man @waleeka.
The tool can create a GraphViz Dot graph. Here is how you can get it:
import hiddenlayer as hl
graph = hl.build_graph(model, input)
graph = graph.build_dot()
graph.render(path, view=True, format='png')