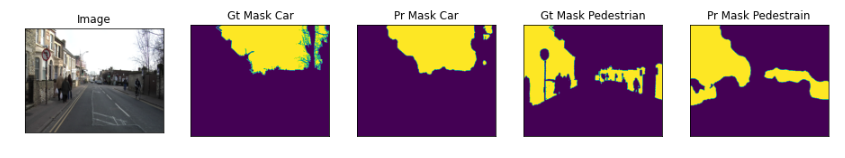
I ran U-net (with softmax) on Camvid data to predict multi-class segmentation. Seems everything ran well but I am having trouble visualizing the predictions. They look flat as shown below.
Full code can be accessed here.
The output looks like this
.
helper function for data visualization
def visualize(**images):
    """PLot images in one row."""
    n = len(images)
    plt.figure(figsize=(16, 5))
    for i, (name, image) in enumerate(images.items()):
        plt.subplot(1, n, i + 1)
        plt.xticks([])
        plt.yticks([])
        plt.title(' '.join(name.split('_')).title())
        plt.imshow(image)
    plt.show()
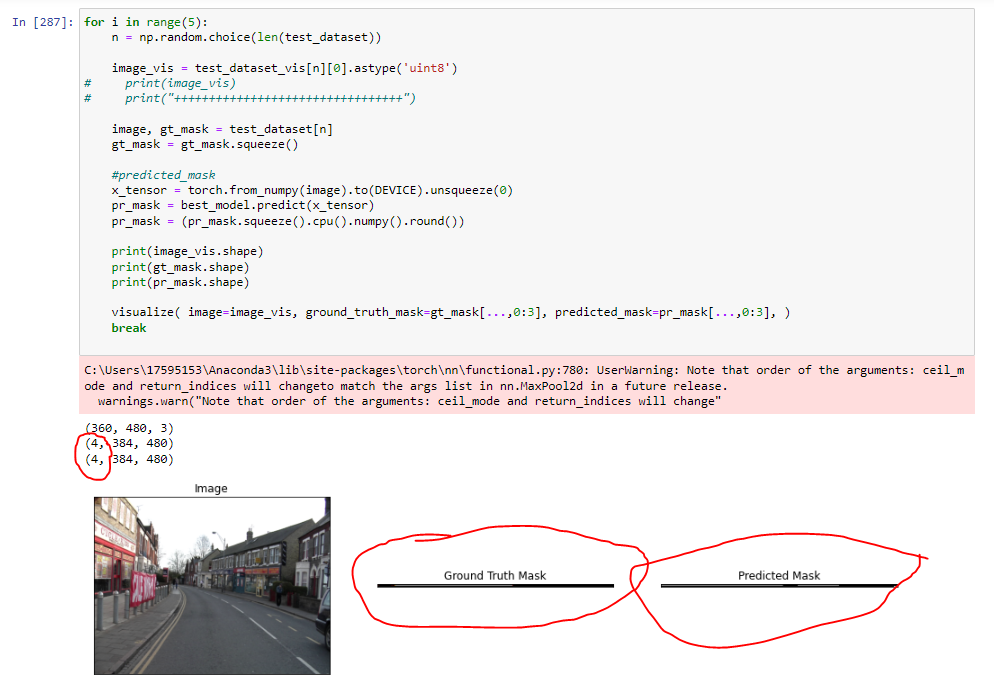
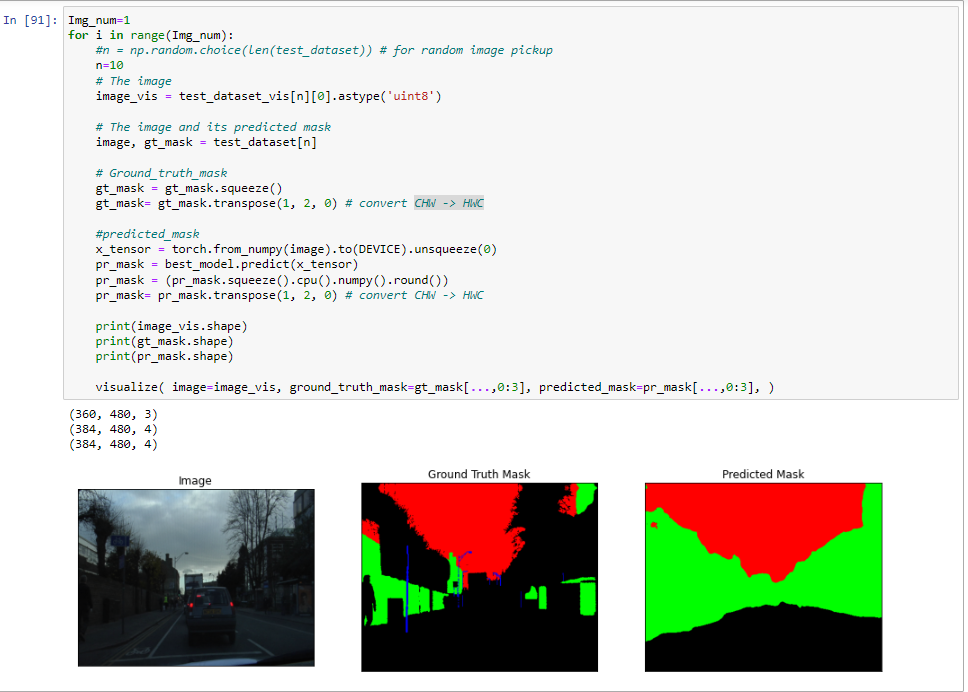
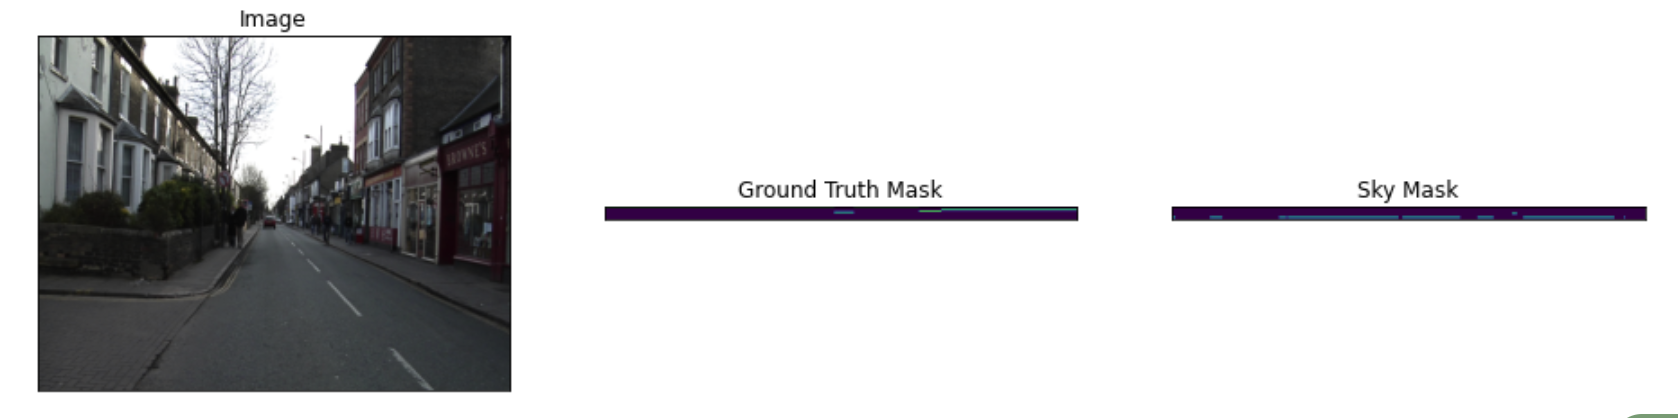
applying visualize on predictions
image, gt_mask = test_dataset[n]
x_tensor = torch.from_numpy(image).to(DEVICE).unsqueeze(0)

gt_mask_0 = (gt_mask[...,0].squeeze())
gt_mask_1 = (gt_mask[...,1].squeeze())

pr_mask = model.predict(x_tensor)
pr_mask_0 = (pr_mask[...,0].squeeze().cpu().numpy().round())
pr_mask_1 = (pr_mask[...,1].squeeze().cpu().numpy().round())

visualize(
    image=image_vis,
    ground_truth_mask=gt_mask_0,
    sky_mask = pr_mask_0
)
gt_mask
array([[[1., 1., 1., ..., 1., 1., 1.],
        [1., 1., 1., ..., 1., 1., 1.],
        [1., 1., 1., ..., 1., 1., 1.],
        ...,
        [0., 0., 0., ..., 0., 0., 0.],
        [0., 0., 0., ..., 0., 0., 0.],
        [0., 0., 0., ..., 0., 0., 0.]],

       [[0., 0., 0., ..., 0., 0., 0.],
        [0., 0., 0., ..., 0., 0., 0.],
        [0., 0., 0., ..., 0., 0., 0.],
        ...,
        [0., 0., 0., ..., 0., 0., 0.],
        [0., 0., 0., ..., 0., 0., 0.],
        [0., 0., 0., ..., 0., 0., 0.]],

       [[0., 0., 0., ..., 0., 0., 0.],
        [0., 0., 0., ..., 0., 0., 0.],
        [0., 0., 0., ..., 0., 0., 0.],
        ...,
        [1., 1., 1., ..., 1., 1., 1.],
        [1., 1., 1., ..., 1., 1., 1.],
        [1., 1., 1., ..., 1., 1., 1.]],

       ...,

       [[0., 0., 0., ..., 0., 0., 0.],
        [0., 0., 0., ..., 0., 0., 0.],
        [0., 0., 0., ..., 0., 0., 0.],
        ...,
        [0., 0., 0., ..., 0., 0., 0.],
        [0., 0., 0., ..., 0., 0., 0.],
        [0., 0., 0., ..., 0., 0., 0.]],

       [[0., 0., 0., ..., 0., 0., 0.],
        [0., 0., 0., ..., 0., 0., 0.],
        [0., 0., 0., ..., 0., 0., 0.],
        ...,
        [0., 0., 0., ..., 0., 0., 0.],
        [0., 0., 0., ..., 0., 0., 0.],
        [0., 0., 0., ..., 0., 0., 0.]],

       [[0., 0., 0., ..., 0., 0., 0.],
        [0., 0., 0., ..., 0., 0., 0.],
        [0., 0., 0., ..., 0., 0., 0.],
        ...,
        [0., 0., 0., ..., 0., 0., 0.],
        [0., 0., 0., ..., 0., 0., 0.],
        [0., 0., 0., ..., 0., 0., 0.]]], dtype=float32)
pr_mask
tensor([[[[0.0089, 0.0096, 0.0101,  ..., 0.0044, 0.0041, 0.0038],
          [0.0094, 0.0098, 0.0099,  ..., 0.0057, 0.0056, 0.0053],
          [0.0097, 0.0097, 0.0094,  ..., 0.0071, 0.0072, 0.0072],
          ...,
          [0.0126, 0.0129, 0.0128,  ..., 0.0063, 0.0070, 0.0076],
          [0.0113, 0.0116, 0.0115,  ..., 0.0062, 0.0073, 0.0086],
          [0.0101, 0.0103, 0.0102,  ..., 0.0060, 0.0077, 0.0097]],

         [[0.0354, 0.0348, 0.0332,  ..., 0.0047, 0.0061, 0.0078],
          [0.0471, 0.0452, 0.0421,  ..., 0.0052, 0.0068, 0.0086],
          [0.0610, 0.0571, 0.0515,  ..., 0.0054, 0.0072, 0.0094],
          ...,
          [0.0111, 0.0161, 0.0225,  ..., 0.0364, 0.0368, 0.0369],
          [0.0078, 0.0115, 0.0165,  ..., 0.0303, 0.0342, 0.0382],
          [0.0054, 0.0081, 0.0120,  ..., 0.0251, 0.0316, 0.0394]],

         [[0.0090, 0.0070, 0.0053,  ..., 0.0049, 0.0055, 0.0061],
          [0.0097, 0.0084, 0.0070,  ..., 0.0065, 0.0074, 0.0082],
          [0.0102, 0.0098, 0.0090,  ..., 0.0084, 0.0096, 0.0106],
          ...,
          [0.0245, 0.0227, 0.0202,  ..., 0.0142, 0.0136, 0.0129],
          [0.0211, 0.0191, 0.0169,  ..., 0.0131, 0.0131, 0.0128],
          [0.0180, 0.0160, 0.0140,  ..., 0.0120, 0.0124, 0.0127]],

         ...,

         [[0.0259, 0.0252, 0.0239,  ..., 0.0033, 0.0048, 0.0068],
          [0.0253, 0.0244, 0.0228,  ..., 0.0043, 0.0060, 0.0082],
          [0.0242, 0.0230, 0.0211,  ..., 0.0052, 0.0072, 0.0097],
          ...,
          [0.0636, 0.0476, 0.0343,  ..., 0.0413, 0.0394, 0.0371],
          [0.0640, 0.0479, 0.0348,  ..., 0.0459, 0.0416, 0.0373],
          [0.0639, 0.0479, 0.0352,  ..., 0.0508, 0.0437, 0.0372]],

         [[0.7196, 0.7019, 0.6668,  ..., 0.6152, 0.5556, 0.4922],
          [0.6529, 0.6269, 0.5832,  ..., 0.5199, 0.4687, 0.4144],
          [0.5768, 0.5427, 0.4922,  ..., 0.4186, 0.3824, 0.3403],
          ...,
          [0.3214, 0.2712, 0.2201,  ..., 0.3356, 0.3038, 0.2719],
          [0.3338, 0.2885, 0.2423,  ..., 0.3139, 0.2817, 0.2503],
          [0.3442, 0.3053, 0.2652,  ..., 0.2915, 0.2599, 0.2290]],

         [[0.0182, 0.0217, 0.0253,  ..., 0.0382, 0.0371, 0.0354],
          [0.0259, 0.0309, 0.0358,  ..., 0.0667, 0.0543, 0.0434],
          [0.0359, 0.0427, 0.0489,  ..., 0.1109, 0.0769, 0.0520],
          ...,
          [0.0222, 0.0215, 0.0199,  ..., 0.1235, 0.1231, 0.1213],
          [0.0250, 0.0241, 0.0225,  ..., 0.1325, 0.1389, 0.1441],
          [0.0278, 0.0268, 0.0253,  ..., 0.1412, 0.1559, 0.1701]]]],
       device='cuda:0')