I use gdb to debug pytorch, but cann’t step in func and get detail func body. And backtrace is discontinuous.
To get more information in gdb rebuild PyTorch with debug symbols via DEBUG=1 python setup.py install.
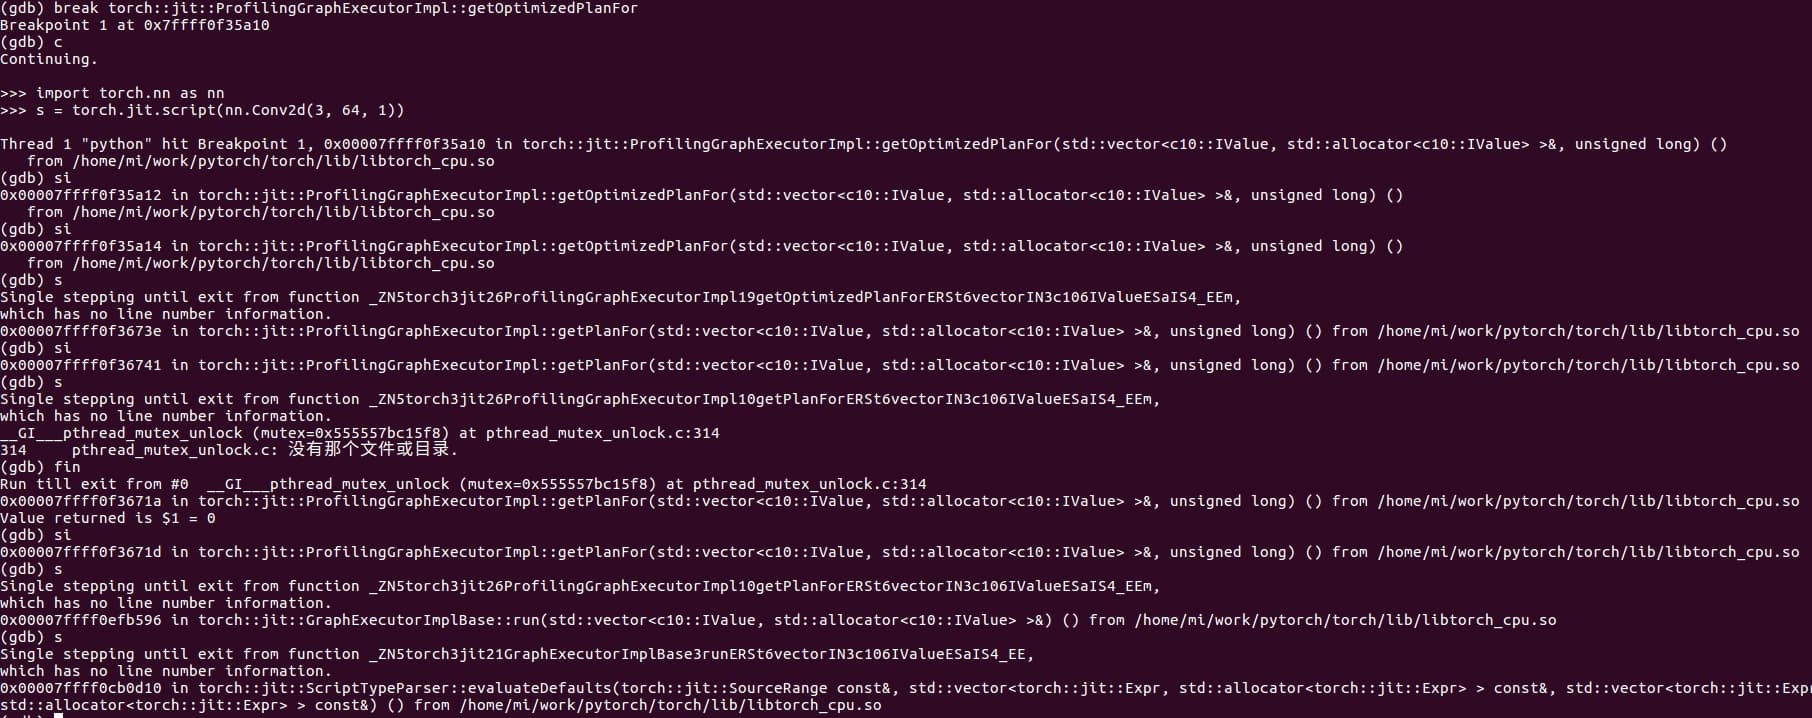
As show above, I found missing debug symbols. When I set breakpoint in the func body like runProfilingOptimizations function, it’s called in ProfilingGraphExecutorImpl::getOptimizedPlanFor function, the debug would hit breakpoint, when I key in si in gdb, it would also print ProfilingGraphExecutorImpl::runProfilingOptimizations, but when I key in s, it will jump out of the func and print ProfilingGraphExecutorImpl::getOptimizedPlanFor. @ptrblck
It seems the breakpoint is the deepest call, cannot step in.
I don’t know why a debug build is not working as I haven’t seen this behavior before (i.e. they work in my setup, but I also haven’t stepped into the mentioned methods).
Solved. python setup.py clean first 