Hi, I’m measuring performance of torchvision’s CNN models in terms of H/W utilization in varying platforms. My PyTorch script is using imagenette-320 and it trains for 5 epochs. I’ve done it on CPU-only environment, and now I’m doing it on GPU(single GPU). But I have several problems. When I run my script, the GPU Utilization is very low. Below is the attachment of the output of deviceQuery.
 CUDA Device Query (Runtime API) version (CUDART static linking)

Detected 1 CUDA Capable device(s)

Device 0: "TITAN Xp"
  CUDA Driver Version / Runtime Version          10.1 / 10.1
  CUDA Capability Major/Minor version number:    6.1
  Total amount of global memory:                 12196 MBytes (12788498432 bytes)
  (30) Multiprocessors, (128) CUDA Cores/MP:     3840 CUDA Cores
  GPU Max Clock rate:                            1582 MHz (1.58 GHz)
  Memory Clock rate:                             5705 Mhz
  Memory Bus Width:                              384-bit
  L2 Cache Size:                                 3145728 bytes
  Maximum Texture Dimension Size (x,y,z)         1D=(131072), 2D=(131072, 65536), 3D=(16384, 16384, 16384)
  Maximum Layered 1D Texture Size, (num) layers  1D=(32768), 2048 layers
  Maximum Layered 2D Texture Size, (num) layers  2D=(32768, 32768), 2048 layers
  Total amount of constant memory:               65536 bytes
  Total amount of shared memory per block:       49152 bytes
  Total number of registers available per block: 65536
  Warp size:                                     32
  Maximum number of threads per multiprocessor:  2048
  Maximum number of threads per block:           1024
  Max dimension size of a thread block (x,y,z): (1024, 1024, 64)
  Max dimension size of a grid size    (x,y,z): (2147483647, 65535, 65535)
  Maximum memory pitch:                          2147483647 bytes
  Texture alignment:                             512 bytes
  Concurrent copy and kernel execution:          Yes with 2 copy engine(s)
  Run time limit on kernels:                     No
  Integrated GPU sharing Host Memory:            No
  Support host page-locked memory mapping:       Yes
  Alignment requirement for Surfaces:            Yes
  Device has ECC support:                        Disabled
  Device supports Unified Addressing (UVA):      Yes
  Device supports Compute Preemption:            Yes
  Supports Cooperative Kernel Launch:            Yes
  Supports MultiDevice Co-op Kernel Launch:      Yes
  Device PCI Domain ID / Bus ID / location ID:   0 / 1 / 0
  Compute Mode:
     < Default (multiple host threads can use ::cudaSetDevice() with device simultaneously) >

deviceQuery, CUDA Driver = CUDART, CUDA Driver Version = 10.1, CUDA Runtime Version = 10.1, NumDevs = 1
Result = PASS
I know that the num_workers and pin_memory parameters of DataLoader may be the issue. I’ve figured out that increasing num_workers improve the performance (with decreased elapsed time) until it reaches 4. (In my platform, the CPU has 4 cores). After 4, there is improvement but it is almost flat. But there is not difference with whether I set pin_memory to True or False, which is not expected according to many discussions I’ve read about this.
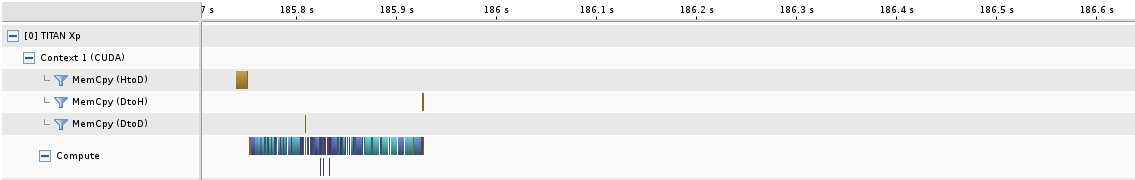
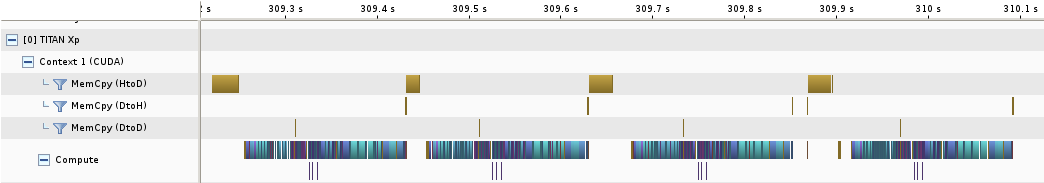
Also, when I profiled my script by varying num_workers, a question comes to my mind. Below is the timeline result of my PyTorch script with num_workers=0 and num_workers=4, respectively, which NVIDIA Visual Profiler is saying. The first one is the computation related to 1 batch and the latter is related to 4 batches, of course. My question is that according to the timeline, non-zero num_workers is not affecting the actual time spent on execution of MemCpy(HtoD) and the MemCpy(HtoD)-Kernel overlapping. In the blank region in the first image, I mean about 186s to 186.6s, there is no information of any modules or functions. Increasing num_workers affects only reduction of the length of that blank region, in which I don’t know what is actually happening. So, I’m wondering that if so, isn’t it quite reasonable to think that data transfer with multi-processes is not actually increasing parallelism on data transfer? Then how it improves the performance? This question appears due to the metrics the profiler tells me. Let me explain this below the image.
NVIDIA Visual Profiler tells me the metrics such as Compute Utilization, MemCpy/Kernel Overlap, MemCpy Overlap, Kernel Concurrency. Increasing num_workers of course boost the Compute Utilization(time spent on kernel divided by the time of total elapsed time), but the maximum is 15% and 24% for ResNet18 and MobileNetV2, respectively. And the metrics about overlap and concurrency I’ve mentioned right above are always 0%, regardless of the num_workers parameter.
pin_memory parameter also does not affect the performance metrics the profiler tells. And I’ve found that there is non_blocking parameters in tensor.to method, which is related to the overlapping of data transfer and computation according to the PyTorch document about CUDA semantics. However, it has not affected the elapsed time and other metrics in my case.
I’ve attached my PyTorch script below. I’ll thank you very much if anyone can give me an advice about my study on this topic. I want to know if there is wrong expectation I’ve had about the performance. Please note that, the reason I define the iterator of DataLoader is to add nvtx flags on data.to(device) method call. I’ve thought that it can help me trace the data transfer in other profilers that can trace nvtx.
import torch
import torch.nn as nn
import torch.nn.functional as F
import torch.optim as optim
import torchvision
import torchvision.transforms as transforms
import torchvision.models as models

# transform
transform_train = transforms.Compose([
    transforms.RandomResizedCrop(224),
    transforms.RandomHorizontalFlip(),
    transforms.ToTensor(),
    transforms.Normalize((0.485, 0.456, 0.406), (0.229, 0.224, 0.225)),
])

transform_test = transforms.Compose([
    transforms.Resize(256),
    transforms.CenterCrop(224),
    transforms.ToTensor(),
    transforms.Normalize((0.485, 0.456, 0.406), (0.229, 0.224, 0.225)),
])

# device
device = torch.device("cuda:0" if torch.cuda.is_available() else "cpu")

# define dataloader
trainset = torchvision.datasets.ImageFolder(root='./data/imagenette-320/train', transform=transform_train)
trainloader = torch.utils.data.DataLoader(trainset, batch_size=128, shuffle=True, num_workers=0)

testset = torchvision.datasets.ImageFolder(root='./data/imagenette-320/val', transform=transform_test)
testloader = torch.utils.data.DataLoader(testset, batch_size=128, shuffle=False, num_workers=0, pin_memory=True)

# define network
# resnet18
net = models.resnet18()

# mobilenet_v2
# net = models.mobilenet_v2()

net = net.to(device)


criterion = nn.CrossEntropyLoss()
optimizer = optim.SGD(net.parameters(), lr=0.1, momentum=0.9, weight_decay=5e-4)
best_acc = 0

def train(epoch):

    if epoch == 100:
        for g in optimizer.param_groups:
            g['lr'] = 0.01
    elif epoch == 150:
        for g in optimizer.param_groups:
            g['lr'] = 0.001

    print('\nEpoch: %d' % (epoch + 1))

    net.train()
    train_loss = 0.0
    correct = 0
    total = 0

    trainloader_iterator = iter(trainloader)

    for batch_idx in range(len(trainloader_iterator)):

        # Load next data
        (inputs, labels) = trainloader_iterator.next()

        # Copy to device
        inputs, labels = inputs.to(device), labels.to(device)

        # Forward + backward
        optimizer.zero_grad()
        outputs = net(inputs)
        loss = criterion(outputs, labels)

        # Backward
        loss.backward()
        optimizer.step()

        # calculate loss
        train_loss += loss.item()

        # calculate accuracy
        _, predicted = outputs.max(1)
        total += labels.size(0)
        correct += predicted.eq(labels).sum().item()

        print('Training -- Loss: %.3f | Acc: %3f%% (%d/%d)' % (train_loss/(batch_idx+1), 100.*correct/total, correct, total), end='\r')
    print('')

def test(epoch):
    net.eval()
    global best_acc
    test_loss = 0
    correct = 0
    total = 0

    with torch.no_grad():

        testloader_iterator = iter(testloader)

        for batch_idx in range(len(testloader_iterator)):

            # Load next data
            inputs, labels = testloader_iterator.next()

            # Copy to device
            inputs, labels = inputs.to(device), labels.to(device)

            # Forward pass
            outputs = net(inputs)
            loss = criterion(outputs, labels)


            # add loss
            test_loss += loss.item()

            # calculate acuracy
            _, predicted = outputs.max(1)
            total += labels.size(0)
            correct += predicted.eq(labels).sum().item()

            print('Testing --- Loss: %.3f | Acc: %3f%% (%d/%d)' % (test_loss/(batch_idx+1), 100.*correct/total, correct, total), end='\r')
    print('')

    acc = 100.*correct/total
    if acc > best_acc:
        # resnet18
        torch.save(net, './models/resnet18.pt')

        # mobilenet_v2
        # torch.save(net, './models/mobilenet_v2.pt')
        best_acc = acc

for epoch in range(0, 5):
    train(epoch)
    test(epoch)