Hi,
I am training yolov3 code from: GitHub - ultralytics/yolov3: YOLOv3 in PyTorch > ONNX > CoreML > TFLite,
the code could be correctly trained. My computer configuration is:
CPU i9-9900k with 32GB RAM
GPU 2080Ti with 11GB memory
the following message is printed during the training:
Using torch 1.7.1+cu101 CUDA:0 (GeForce RTX 2080 Ti, 11264.0MB)
Namespace(adam=False, batch_size=8, bucket='', cache_images=False, cfg='', data='data/coco128.yaml', device='',
epochs=300, evolve=False, exist_ok=False, global_rank=-1, hyp='data/hyp.scratch.yaml', image_weights=False,
img_size=[640, 640], local_rank=-1, log_imgs=16, multi_scale=False, name='exp', noautoanchor=False, nosave=False,
notest=False, project='runs/train', rect=False, resume=False, save_dir='runs\\train\\exp', single_cls=False, sync_bn=False,
total_batch_size=8, weights='yolov3.pt', workers=8, world_size=1)
Start Tensorboard with "tensorboard --logdir runs/train", view at http://localhost:6006/
Hyperparameters {'lr0': 0.01, 'lrf': 0.2, 'momentum': 0.937, 'weight_decay': 0.0005, 'warmup_epochs': 3.0,
'warmup_momentum': 0.8, 'warmup_bias_lr': 0.1, 'box': 0.05, 'cls': 0.5, 'cls_pw': 1.0, 'obj': 1.0, 'obj_pw': 1.0,
'iou_t': 0.2, 'anchor_t': 4.0, 'fl_gamma': 0.0, 'hsv_h': 0.015, 'hsv_s': 0.7, 'hsv_v': 0.4, 'degrees': 0.0, 'translate': 0.1,
'scale': 0.5, 'shear': 0.0, 'perspective': 0.0, 'flipud': 0.0, 'fliplr': 0.5, 'mosaic': 1.0, 'mixup': 0.0}

......

Model Summary: 333 layers, 61949149 parameters, 61949149 gradients, 156.4 GFLOPS
Transferred 440/440 items from yolov3.pt
Optimizer groups: 75 .bias, 75 conv.weight, 72 other
Scanning 'C:\doc\dataset\COCO\labels\train2014.cache' for images and labels... 122218 found, 0 missing, 0 empty, 0 corrupted: 100%|██████████| 122218/122218 [00:00<?, ?it/s]
Scanning 'C:\doc\dataset\COCO\labels\train2014' for images and labels... 42219 found, 0 missing, 0 empty, 0 corrupted: 100%|██████████| 42219/42219 [01:12<00:00, 582.44it/s]
New cache created: C:\doc\dataset\COCO\labels\train2014.cache
Scanning 'C:\doc\dataset\COCO\labels\train2014.cache' for images and labels... 42219 found, 0 missing, 0 empty, 0 corrupted: 100%|██████████| 42219/42219 [00:00<?, ?it/s]
Analyzing anchors... anchors/target = 4.41, Best Possible Recall (BPR) = 0.9943
Note: NumExpr detected 16 cores but "NUMEXPR_MAX_THREADS" not set, so enforcing safe limit of 8.
NumExpr defaulting to 8 threads.
Image sizes 640 train, 640 test
Using 8 dataloader workers
Logging results to runs\train\exp
Starting training for 300 epochs...
     Epoch   gpu_mem       box       obj       cls     total   targets  img_size
	0/299     7.32G   0.03043   0.02528  0.009495   0.06521        83       640:  26%|██▌       | 3982/15278 [18:47<49:17,  3.82it/s]
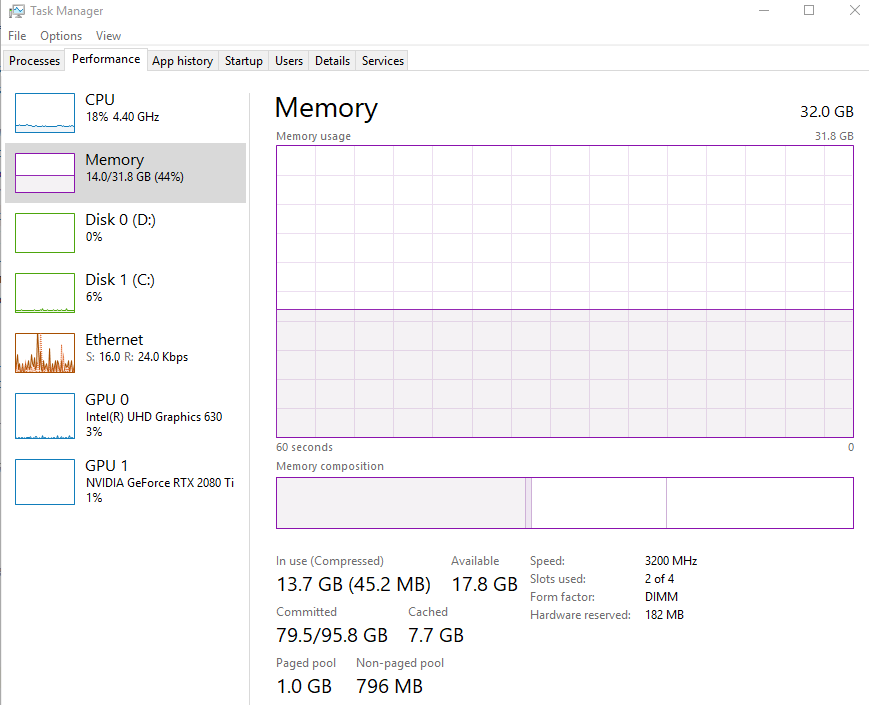
during the training, I capture the RAM usage.
There is 32GB RAM and 17.8GB available. virtual memory assigned is 95.8GB and used is 79.5GB.
According to my understanding, if physical memory is not sufficient, CPU will apply virtual memory. in my case, there are 17.8GB physical memory available, why is so much virtual memory used? how is it used?