the logs in log file includes ‘XXXXXXXXXXXXXXXXXXXXXXXXXXXXXXXXXXXX\n’.
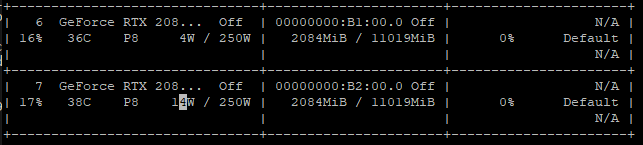
however, some GPU memory is still in use and GPU util is 0%.
it seems that process doesn’t exit, or process exist but memory is not cleaned.
is there any solution for this problem?
I used the following code to start 2 processes: CUDA_VISIBLE_DEVICES=6,7 WORLD_SIZE=2 python -m torch.distributed.launch --nproc_per_node=2 --master_port 44744 train.py
def runner_full(ctp):

	logs = open('log.txt', 'a')
	train(ctp) # in train we will use GPU to train network
	torch.cuda.empty_cache()

    logs.write('XXXXXXXXXXXXXXXXXXXXXXXXXXXXXXXXXXXX\n')
    logs.flush()
    logs.close()
    return

if __name__ == "__main__":

    ctp = {'a':0, 'b':1, 'c':2}
    runner_full(ctp)
Based on the high memory usage I assume that you are either not deleting all references to CUDATensors or other processes might be using the GPU memory.
PyTorch itself will create the CUDA context, which won’t be released by calling torch.cuda.empty_cache(), and which will use approx. 600-1000MB of device memory.
I did many experiments and found out that the process won’t exit if I enumerate dataload in my train function.
the interesting thing is:
if I use torch.distributed.launch to launch 2 processes, the loader will result in the process won’t exit.
If I run 1 process directly(python train.py), the process will exit correctly.
Furthermore, I confirm no process use the GPU as I am doing experiment on the machine myself.
I suspect there might be 2 reasons:
as you said some Tensor or memory is not released. is there a way to check/confirm this?
generator(like yeild in dataloader) might not exit.
is there any way to check/confirm above 2 issues?
or do you have any idea about what I explained?