I’m trying to replace scipy.signal with torch for audio preprocessing (and I don’t want to use torchaudio because I need to export the whole pipeline to C++).
So, I need log-spectrogram, which is S = log(|STFT(x)|^2), but I get unexpected shapes from pytorch.
Minimal code to reproduce:
from scipy import signal
import torch

data = np.random.uniform(-1, 1, 22500)
n_fft = 256

s, t, z = signal.spectrogram(data, nperseg=n_fft)
ss = torch.stft(torch.Tensor(data), n_fft)

print(z.shape)  # (129, 100)
print(ss.shape) # torch.Size([129, 352, 2])
You can see that the shapes do not match, and the output of torch has a lot of infs/nans:
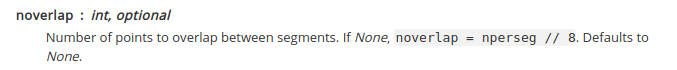
plt.spy(z) :
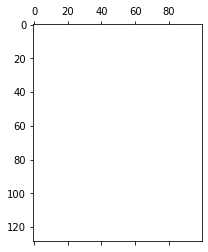
plt.spy(np.log(ss[:,:, 0]*ss[:, :, 1])):
How can I properly compute the spectrogram using torch only?