I am new to Pytroch,
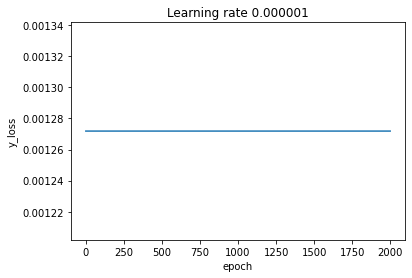
I am modelling a neural network for binary classification. I am obtaining a straight line in loss vs epochs. Is that right?
Below is my code:
y_loss=
for t in range(epochs):
train_loss = 0
for batch, (X, y) in enumerate(train_dataloader):
    # Compute prediction and loss
    pred = model(X)
    train_loss = loss_fn(pred, y)

    # Backpropagation
    optimizer.zero_grad()# zero the gradient buffers
    train_loss.backward()
    optimizer.step()# Does the update

    if batch % 100 == 0:
      y_loss.append(train_loss.item() / dataset_size)
In my opinion is not right. A correct plot of the losses should exhibit a descending curve, to demonstrate the fact that over the epochs the loss decreased hence the network was learning properly. There must be something wrong with the computation of the loss, because it is very weird that is never changes over 2000 epochs.
What loss function are you using?
Moreover, note that the title of the plot is no sense: the learning rate is an hyperparameter regarding the optimizer, and it affects the step that the gradient descent takes (i.e. “acceleration” with which the algorithm run). I suggest you to explore a bit more the theory behind the different elements of a neural network training phase.