I am trying to neatly log my train/val losses for a KFold training scheme.
I want all the train losses between the K folds to be on the same multi-line graph. Similarly for the val losses. I also want this to be done with 1 SummaryWriter object so my /runs/ folder is neat.
So far I’ve researched and messed around with add_scalars() and add_custom_scalars(). Nothing has given me the correct layout. add_scalars() keeps making extra SummaryWriters and filling up the /runs/ folder.
Here is the layout dictionary I’m using:
layout = {'loss': {'train': ['Multiline', [f"train/fold{i}" for i in range(N_FOLDS)]],
                    'val': ['Multiline', [f"val/fold{i}" for i in range(N_FOLDS)]]}}
and how I’m currently trying to hook up the add_scalar() calls to this layout:
writer.add_scalar(f'loss/train/fold{i_fold}', train_loss, epoch)
writer.add_scalar(f'loss/val/fold{i_fold}', val_loss, epoch)
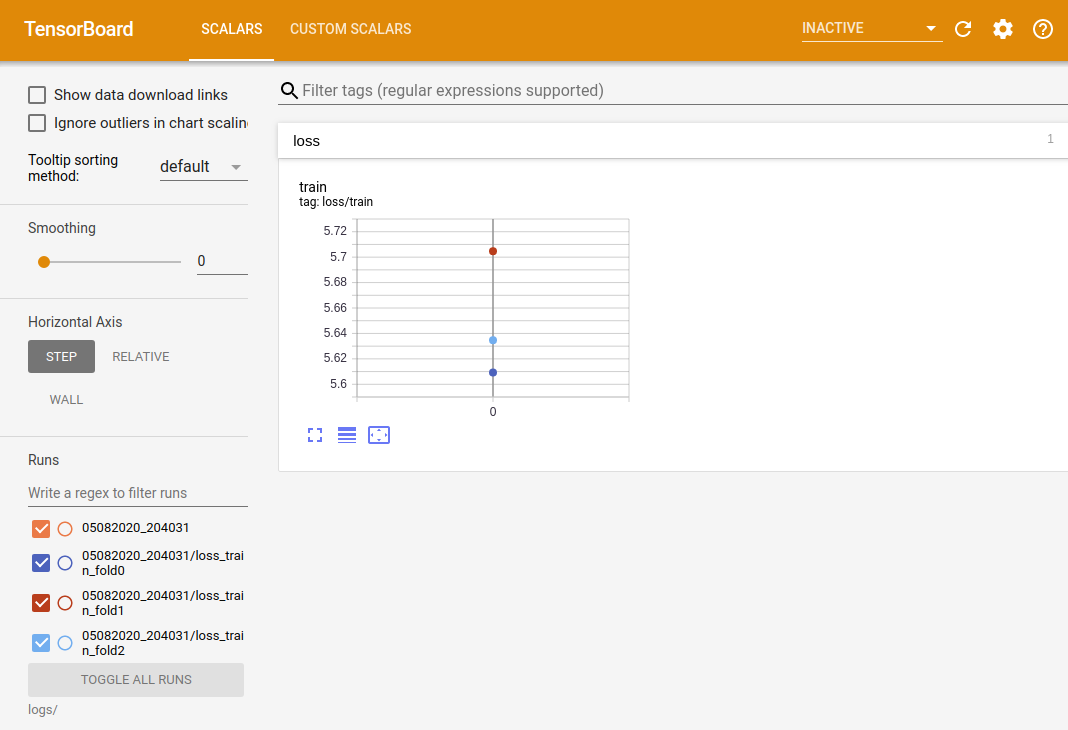
But here is what I’m getting, each curve for training loss is on its own axes.
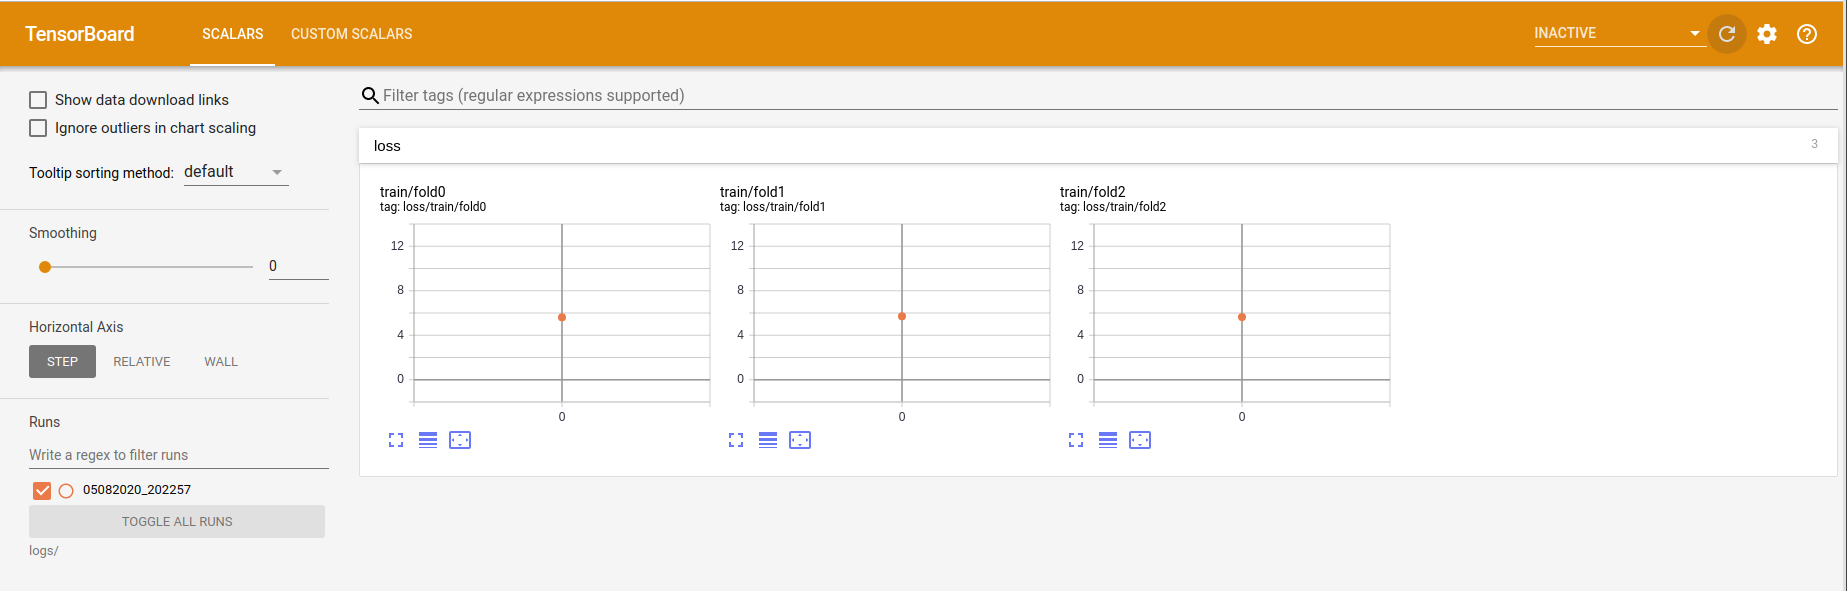
Thanks