Training multiple machines in one GPU

Hi!

So I have a question, I have this recursive algorithm to train multiple Neural Networks in different domains, but same architecture , every time you go deeper into the algorithm the less training data you have, meaning it should be faster training the deeper you go.

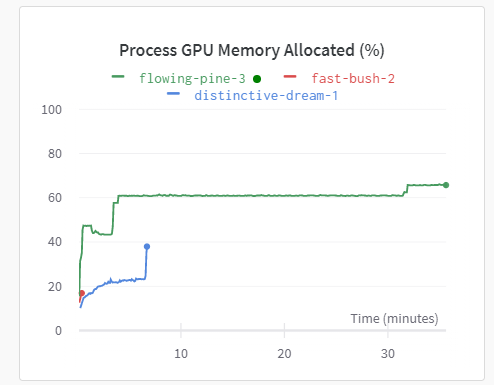
I tested my algorithm with a small(2000) training set to be sure that it worked. And it does work! But now i want to try it with more real world training set, with size 262144(512x512). Since I knew I was going to work with the GPU so I tried to carefully move variables to the GPU only if I needed it.

When I ran it, I saw that the first network I trained(with the biggest training set of 512x512 samples) trains quite fast it takes 130s. However, next one that is going to be trained using only 60% of the data to train it, takes significantly way more(I have taken the time to see how much it actually takes because it so long). But if I test the network using that 60% of the data to train it, it takes approximately 50s.

Now that you have the context my question is the following. Is there any way that the first network I trained slows the second one?

I will show you the NN and the my training functions:

class MLPflat(nn.Module):
    def __init__(self,in_dim: int, out_dim: int, N, H):
      super().__init__()
      assert(N > 0)
      assert(H > 0)

      net = [nn.Linear(in_dim, H),nn.BatchNorm1d(H), nn.LeakyReLU()]
      
      for _ in range(N-1): # make N layers
        net += [nn.Linear(H, H),nn.BatchNorm1d(H), nn.LeakyReLU()]
        
      net += [nn.Linear(H,out_dim,bias=False)]
      self.model = nn.Sequential(*net)

    def forward(self, x):
      x = self.model(x)
      output = x
      return output

I use N(hidden layers) = 5 and H = 64.

def train(phi,train_loader,epochs,criterion,optimizer):
    fit_start_time = time.time()

    for epoch in range(epochs):
        batch = 0
        for x_batch, y_batch in train_loader:
            optimizer.zero_grad()
            print(x_batch.shape)
            y_pred = phi(x_batch.to(device))
            
        
            loss = criterion(y_pred.squeeze(), y_batch.to(device).squeeze())

            loss.backward(retain_graph=True)# I retain the graph because I get an error if I don't do it.
            optimizer.step() 
            batch+=1
    
    fit_end_time = time.time()
    print("Total time = %f" % (fit_end_time - fit_start_time))
    

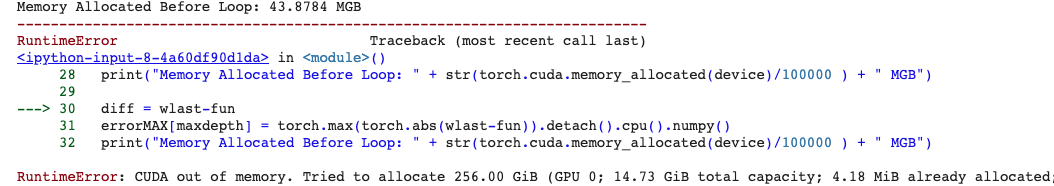
I tried to do is to get rid any tensor inside of the GPU I don’t need. However it didn’t seem to improve.

I think that this problem is not really apparent in with really small training sets, but only comes when I train it with big amounts of training samples.

I would love to hear if this problem sounds like anything you have encounter before. If this is not enough let me know and I could elaborate more on my algorithm.

I tried to reproduce your issue locally, but it seems the performance scales alright:

def train(model, data, target, epochs, criterion, optimizer):
    torch.cuda.synchronize()
    fit_start_time = time.time()

    for epoch in range(epochs):
        optimizer.zero_grad()
        output = model(data)        
        loss = criterion(output, target)
        loss.backward()
        optimizer.step() 
        
    torch.cuda.synchronize()
    fit_end_time = time.time()
    time_per_iter = ((fit_end_time - fit_start_time) / epochs) * 1000
    print('{:.3f}ms/iter'.format(time_per_iter))
    return time_per_iter

model = MLPflat(10, 10, 5, 64).cuda()
data = torch.randn(2000, 10).cuda()
target = torch.randn(2000, 10).cuda()
criterion = nn.MSELoss()
optimizer = torch.optim.Adam(model.parameters(), lr=1e-3)

# warmup
train(model, data, target, 10, criterion, optimizer)
t0 = train(model, data, target, 100, criterion, optimizer)

data = torch.randn(20000, 10).cuda()
target = torch.randn(20000, 10).cuda()
train(model, data, target, 10, criterion, optimizer)
t1 = train(model, data, target, 100, criterion, optimizer)

The 2000 samples run takes approx. 6.671ms/iter, while the 20000 samples take 35.873ms/iter.
What timings are you seeing?

Could you tell the order of magnitude of the time until you gave up?
Something like it took some minutes, some hours, or some days - it may be obvious to many readers, but not for all.
As a half-joking example of context dependance of it:
A statistician and an astrophysicist have significantly different intuitition for
“takes significantly way more”.

Sorrry for the late reply! I thought I put notifications on. Yes you are right, I just ran it today for one 1 recursive depth(this trains 5 different networks of shapes (5 hidden layers,64 neurons) )This takes more than hour. Comparing it to the low resolution would be 12s.

I ran a test of the GPU Memory allocation and it seems that the problem is that I’m giving a lot of to the GPU and not erasing un necessary data.

You can see the spike of of memory allocation in this graphimage_2020_11_19T16_53_01_374Z

@ptrblck sorry for the late reply thank you! It should scale quite good, however since is a recursive algorithm it seems that I’m something bad with the memory allocation of the GPU since it seems it is increasing with every iteration(of the algorithm).

I’m trying to erase stuff that is not necessary, but I can’t seem to find what is it exactly. I will try to print for each line of code I have something like this:

str(torch.cuda.memory_allocated(device)/100000 )

So I know what is the difference of memory and try to see where is exactly it is.

@ptrblck and @Volker_Siegel I just found the culprit. It seems the evaluating of this happens after I evaluate it:

phi.eval()
inTrainTodevice = inTrain.to(device) # GPU
print("Memory Allocated before Evaluating " + str(torch.cuda.memory_allocated(device)/100000 ) + " MGB")
yPredictThisLevel = phi(inTrainTodevice[:,:indim]) # GPU
print("Memory Allocated after Evaluating " + str(torch.cuda.memory_allocated(device)/100000 ) + " MGB")

The memory allocation jumps like this:

Memory Allocated after dividing of batches 0.43008 MGB
Memory Allocated after Training 1.58208 MGB
Memory Allocated before Evaluating 33.03936 MGB
Memory Allocated after Evaluating 6083.32288 MGB

But I don’t understand why this is the case, since is just a simple evaluation. Do you have any ideas why this would be the case?

I assume you don’t want to calculate the gradients during evaluation, so you could wrap the evaluation code into a with torch.no_grad(), which would avoid storing the intermediate tensors and would not attach the computation graph to the output tensors.
Are you using a larger batch size or generally a larger input during evaluation, which could explain the memory increase?

1 Like

@ptrblck thanks! yes yesterday evening made the this change and it help a lot. And now it the memory allocation stays stable.

But now I have another odd problem. I still don’t understand what exactly overloads the memory and what doesn’t. For example: I do a simple difference between two tensor and it allocates so much memory that it breaks.

Could you check the shapes of wlast and fun? You might be broadcasting the tensors (which might not be what you want) and thus the memory could increase significantly.
Here is a small example:

x = torch.randn(10, 1)
y = torch.randn(1, 10)
diff = x - y
print(diff.shape)
> torch.Size([10, 10])
1 Like

Ok it seems that I was doing something wrong: I will fix it to see if that helps.image

What does it mean broadcasting the tensors? I apologize for my ignorance.

PyTorch uses broadcasting to expand smaller dimensions in your tensors, so that they would match the expected tensor shapes for the current operation, if possible.
The numpy doc explains it pretty well.

In your example I assume you would like to subtract the tensors elementwise.
However, since the first tensor has an additional dimension, broadcasting will be applied as seen in this better example:

# expected
x = torch.arange(10)
y = torch.arange(10)
diff = x - y
print(diff)
> tensor([0, 0, 0, 0, 0, 0, 0, 0, 0, 0])

# your code
x = torch.arange(10).view(10, 1)
y = torch.arange(10)
diff = x - y
print(diff)
> tensor([[ 0, -1, -2, -3, -4, -5, -6, -7, -8, -9],
          [ 1,  0, -1, -2, -3, -4, -5, -6, -7, -8],
          [ 2,  1,  0, -1, -2, -3, -4, -5, -6, -7],
          [ 3,  2,  1,  0, -1, -2, -3, -4, -5, -6],
          [ 4,  3,  2,  1,  0, -1, -2, -3, -4, -5],
          [ 5,  4,  3,  2,  1,  0, -1, -2, -3, -4],
          [ 6,  5,  4,  3,  2,  1,  0, -1, -2, -3],
          [ 7,  6,  5,  4,  3,  2,  1,  0, -1, -2],
          [ 8,  7,  6,  5,  4,  3,  2,  1,  0, -1],
          [ 9,  8,  7,  6,  5,  4,  3,  2,  1,  0]])

As you can see, the second approach subtracts the y from each row in x and broadcasts the row value to match the dimensions.
This would increase the memory usage to store the result and might not be what you want to use.