Hi!
i saw a lot of questions that remained unanswered e.g. here; This examples uses keras. I’m asking this question here for an pytorch example.
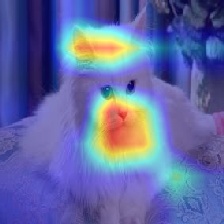
Papers usually report images likes that 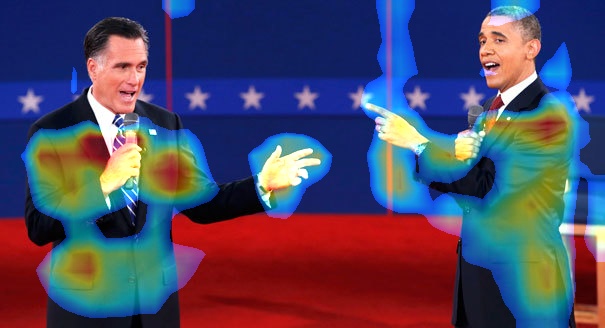
or like that
I really want to know how this can be achieved using pytorch.
Getting the output of my last conv layer (32,2048,7,7), I managed to select three channel and output one image from the batch (3,7,7) but end up with an image like that
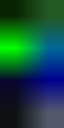
which is of course different from what i want to achieve
Thank you in advance. An example with a ResNet50 model will be much appreciated