Hi Pytorch community!
I’m a bit new to the whole field and thus decided to work on the MNIST dataset. I pretty much adapted the whole code from examples/mnist/main.py at main · pytorch/examples · GitHub, with only one significant change: Data Loading. I didn’t want to use the available MNIST dataset within Torchvision. So I used MNIST in CSV.
I loaded the data from CSV file by inheriting from Dataset and making a new dataloader.
Here’s the relevant code:
mean = 33.318421449829934
sd = 78.56749081851163
# mean = 0.1307
# sd = 0.3081
import numpy as np
from torch.utils.data import Dataset, DataLoader

class dataset(Dataset):
    def __init__(self, csv, transform=None):
        data = pd.read_csv(csv, header=None)
        self.X = np.array(data.iloc[:, 1:]).reshape(-1, 28, 28, 1).astype('float32')
        self.Y = np.array(data.iloc[:, 0])

        del data
        self.transform = transform

    def __len__(self):
        return len(self.X)

    def __getitem__(self, idx):
        item = self.X[idx]
        label = self.Y[idx]

        if self.transform:
            item = self.transform(item)

        return (item, label)

import torchvision.transforms as transforms
trainData = dataset('mnist_train.csv', transform=transforms.Compose([
    transforms.ToTensor(),
    transforms.Normalize((mean,), (sd,))
]))
testData = dataset('mnist_test.csv', transform=transforms.Compose([
    transforms.ToTensor(),
    transforms.Normalize((mean,), (sd,))
]))

train_loader = DataLoader(dataset=trainData,
                         batch_size=10,
                         shuffle=True,
                         )
test_loader = DataLoader(dataset=testData,
                        batch_size=10,
                        shuffle=True,
                        )
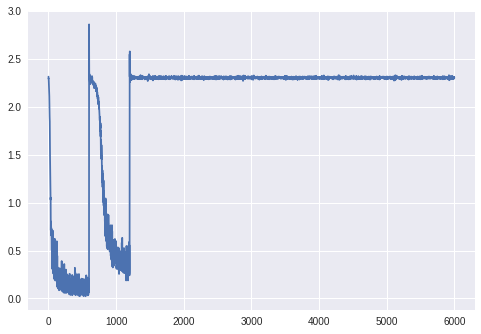
However this code gives me the absolutely weird training error graph that you see in the picture, and a final validation error of 11% because it classifies everything as a ‘7’.
I managed to track the problem down to how I normalize the data and if I use the values given in the example code (0.1307, and 0.3081) for transforms.Normalize, along with reading the data as type ‘uint8’ it works perfectly, giving 99% accuracy.
Note that there is very minimal difference in the data which is provided in these two cases. Normalizing by 0.1307 and 0.3081 on values from 0 to 1 has the same effect as normalizing by 33.31 and 78.56 on values from 0 to 255. The values are even mostly the same (A black pixels corresponds to -0.4241 in the first case and -0.4242 in the second.
If you would like to see a IPython Notebook where this problem is seen clearly, please check out Google Colab
I am unable to understand what has caused such a huge difference in behaviour within these two data sets. Any help would be massively appreciated