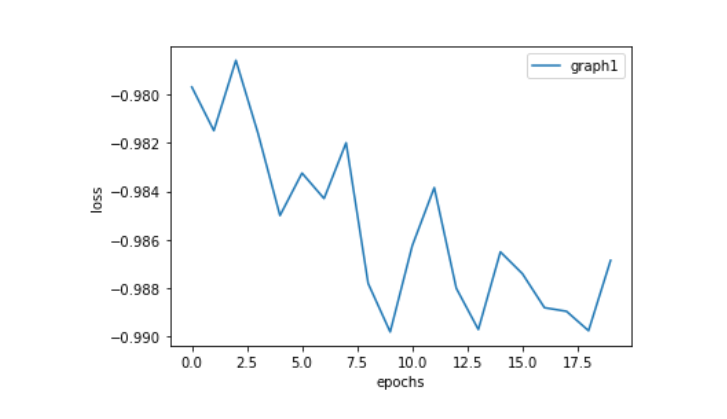
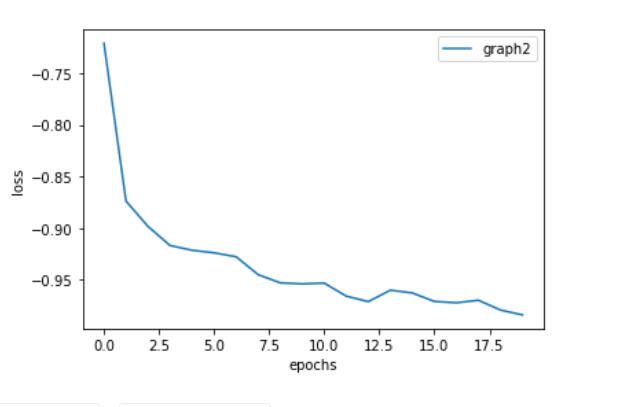
I was working on two model that achieve similar accuracy. Can someone help me know what can one infer from graph1 and graph2 loss functions plotted as below ?? I will be posting the other graph in replies as forum allows meh to post only one picture