Where does `torch._C` come from?

I am read the code of batch normlization, and I find this line:

f = torch._C._functions.BatchNorm(running_mean, running_var, training, momentum, eps, torch.backends.cudnn.enabled)

But I do not find any library called the _C. I do not know where does torch._C.functions.BatchNorm come from.

9 Likes

Here is the C source for PyTorch https://github.com/pytorch/pytorch/tree/master/torch/csrc
And the external libraries that perform the math computation can be found in https://github.com/pytorch/pytorch/tree/master/torch/lib

10 Likes

For completeness, the _C comes from here

6 Likes

hi, fmassa. I want to find the defination of torch._C.CudaFloatTensorBase class.But i didn’t find it in the torch/csrc/Module.cpp.Do you know where is it? Thanks.

@lmf we do these things via C macro expansions:

1 Like

Thanks for the two links, I tried a lot but I still could not find exactly where torch._C._functions.ConvNd come from, could you give me an exact link? Thanks a lot!

Hi

The module torch._C._functions is created here.
The ConvNd class is added on this line.

3 Likes

Thanks @albanD
One more thing, and very important, is how do I understand this line of code addClass<ConvForward, ConvCtor>(module, ConvClass, "ConvNd", conv_forward_properties); , because I plan to learn C and understand the logic of each function in Torch Neural Network library.

I have to admit at this moment I have not learnt C language, so could you just give me a basic idea of what does this line of code do?

Thanks a lot!

@dl4daniel this is C++. Without knowing C or C++, it’s not easy to give you a basic idea of what’s going on.

Thanks for your reply! Could you give me a basic picture while assuming I am a C or C++ beginner, is it feasible? thanks

@smth @albanD @apaszke
Is it possible to debug from pytorch code into torch._C code?

I can use pdbpp to debug pytorch code and check all variables values and it is very convenient for learning. for example, when I want to see what is going on inside ‘self.conv1(x)’, I can step into

27  ->         x = F.max_pool2d(F.relu(self.conv1(x)), (2, 2)) 

and eventually, I am taken to the following code, which is the edge between pytorch python and torch._C. I want to be able to continue to debug and checkout variable values inside torch._C code such as ConvNd below. Is it possible? if so, how could I do it? Thanks a lot

50         f = ConvNd(_pair(stride), _pair(padding), _pair(dilation), False,
51                    _pair(0), groups, torch.backends.cudnn.benchmark, torch.backends
52         return f(input, weight, bias)

Hi,
Yes you can do it but since you are going into cpp land, you will need a cpp debugger.
If you have a cpp ide you may have a debugger in it.
To check stack traces and basic values without any graphical tool you can use gdb, but this is significantly less user friendly.

If you are not used to cpp debugger, it may be simpler to just add prints into the function and recompile pytorch with your prints. You can find here some cpp dev tips for pytorch.

3 Likes

@albanD thanks a lot!
You are very right about gdb, I spend several hours to install gdb and tried to get it work for running python file, but still failed to get it work properly

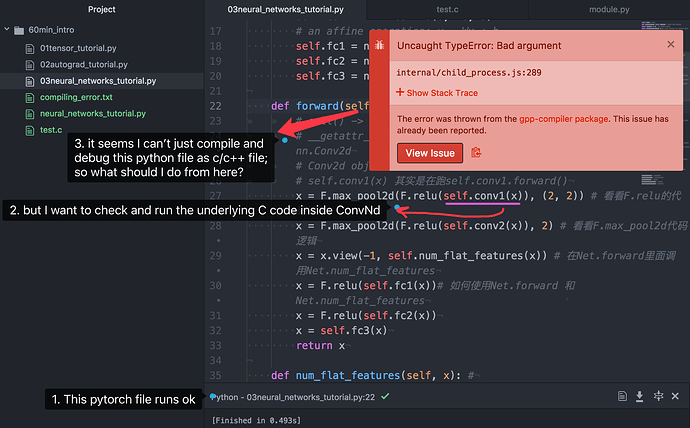
I prefer a simple solution to my problem above: how to check or debug pytorch code all the way from python code to C code or C++ code. If I understand you correctly, it seems the simple solution for me is to pick a C/C++ ide with a debuger. I have been using atom for a while. Is it possible to make atom a proper C/C++ ide? if so, can I use it to check or debug pytorch code from python to C and C++ in one go within atom?

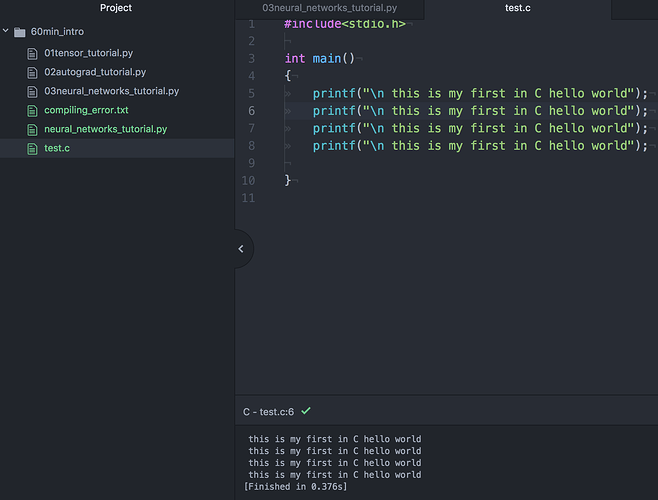
right now, it seems I can compile and run C/C++ in atom OK

However, I can’t just compile and debug my pytorch code as if it is a C/C++ file. Also, although it says “compile and debug”, I don’t see any features like gdb or pdb in atom. What should I do from here? Thanks a lot!

I have never used Atom, so I can’t really help you here unfortunately. You may be able to find more information on google though :slight_smile:

Thanks for your patience! one last question, put atom aside, for a c/c++ ide with debuger, we can use C/C++ debugger to debug a pytorch file like “neural_network_tutoral.py”, for both python code and C code like ConvNd under the hood, right?

I am not aware of any IDE that would be able to do that. I think you will have to have two different debuggers.

Thanks, so two debugers (one for python, one for C/C++) for the same pytorch tutorlal in python. This is interesting.

The same thing happens in numpy if you want to debug C code there.

Thanks, could you give me a simple demo on how to debug C code in a numpy code example?

Well, you usually want to debug in C when you have segmentation faults, as you don’t have any information that was returned from C.

If you want to debug from python, you can use pdb.

Note: in most cases you don’t need to go into gdb to debug a python program, because the libraries were designed to give meaningful error messages and not segfault. In the numpy case that I will show below, I will use an unsafe numpy function to obtain the segfault, but that should not happen with normal numpy code. The same applies for pytorch, so if you observe segmentation faults, please let us know :slight_smile:

If you want to go into debugging C, you can use gdb for example. Say you have a python script example.py that gives a problem. Here I’ll post an example in numpy, called example.py:

import numpy as np
from numpy.lib.stride_tricks import as_strided

a = np.array([1, 2, 3])
b = as_strided(a, shape=(2,), strides=(20,))
# accessing invalid memory, will segfault
b[1] = 1

If you try running it in python, it will give segmentation fault. Try running python example.py.

To run it on gdb, you can do something like

gdb python

and then, once it enters gdb, you do

run example.py

This will run the program and, when it crashes, it will give you the possibility to inspect where it crashed by running bt (from backtrace). You can find more information on gdb options online.
3 Likes