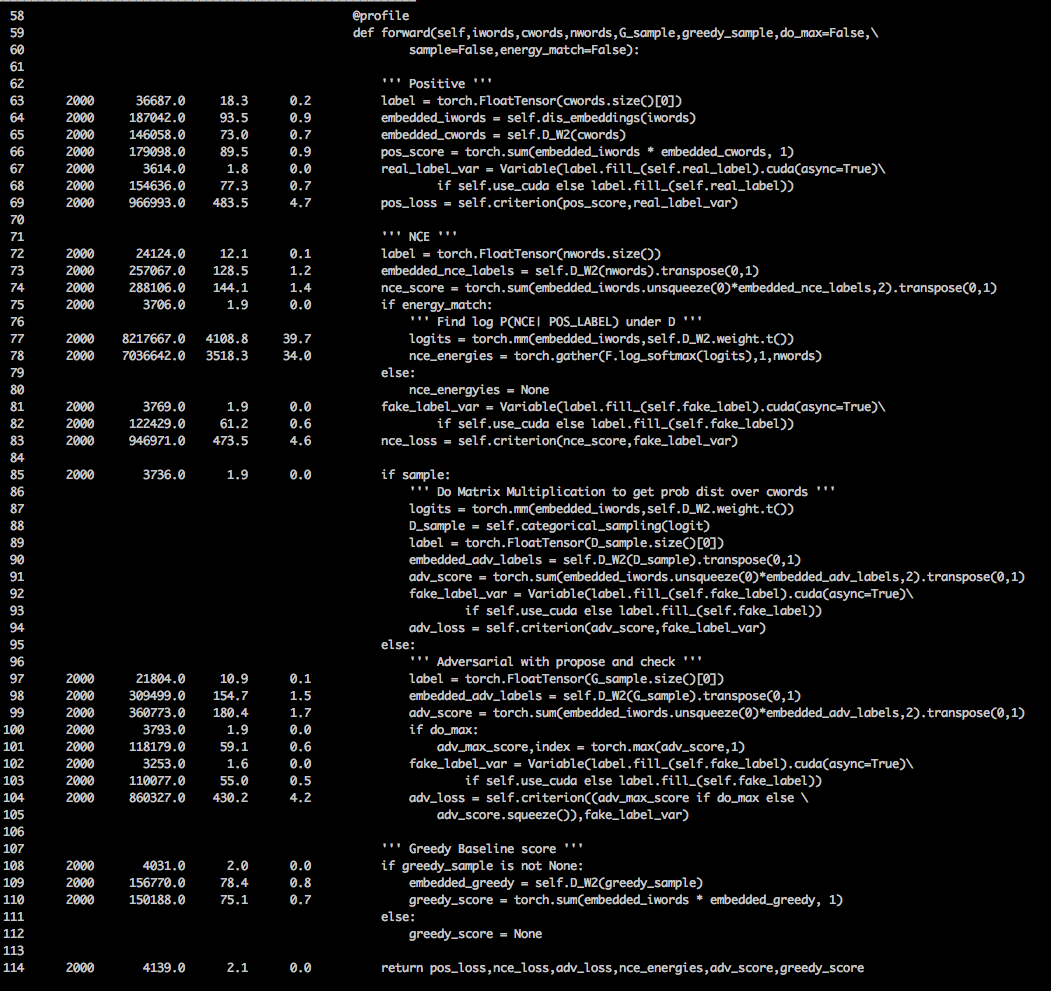
I’m struggling to understand why nn.BCEWithLogitsLoss() is the most expensive part of my training loop. What I find even more surprising is that if I compute the Loss on multiple inputs in the same forward pass i.e. call nn.BCEWithLogitsLoss() multiple times with different inputs the first call is always the bottleneck. I have profiled my code line 69 takes 93% of the computation time (this includes forward and backward passes averaged over 1000 iterations). From an algorithmic design perspective what is the best way to reduce the execution time?

I’m wondering if the reason why it is slow is because it’s mostly implemented in python instead of the C/C++ backend. I’ve opened a feature request to implement it in the C/C++ backend here: https://github.com/pytorch/pytorch/issues/5155
Hi,
I guess you run this on gpu?
The point is that the cuda api is asynchronous, and to speed things up as much as possible, pytorch will not block while operations are running on gpu unless you ask for the result on cpu side.
I guess your criterion here is the first place where things are needed on the cpu side and so it is waiting for all operations that were queued on the GPU to finish running.
To get accurate timings while running on GPU, you would need to use torch.cuda.synchronize() to explicitly wait for operations on GPU to finish. Or with the debugger you’re using, use the CUDA_LAUNCH_BLOCKING=1 env variable from CUDA (you can look online for more details), but this can affect the performances quite a bit and I’m not sure this will give proper timings.
Thanks for the tip, my code was running using a multi-gpu setup so initially CUDA_LAUNCH_BLOCKING=1 was not possible. I reran it using a single GPU with profiling and this the result. This is more sensible now, but in the interest of optimization to the max, I wonder if there’s anything more that can be done?
Incidentally what do you use to profile?