Thanks for the information.
In that case your model might overfit on a class.
To counter it, you could use a weighted criterion or oversample the minority class using WeightedRandomSampler.
I tried using them both in the past, but either I used them wrong or it just did not work.
I created a balanced version of the training dataset, and will post the results here if it solves my issues.
Thanks
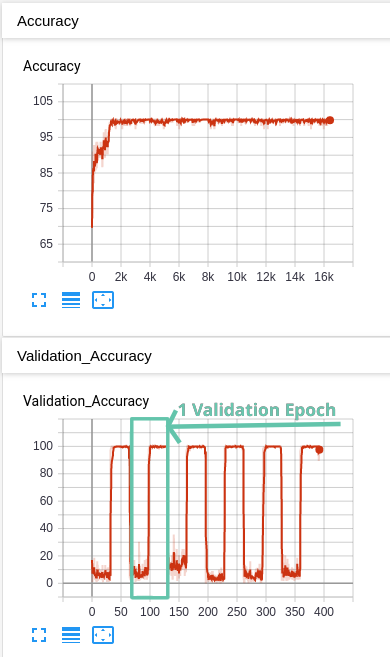
I just made a correction in the last response. The blue graph represents on epoch of training, not one batch. In that case, the batch size was 112 images, and it looped for 650 times to cover the entire validation dataset of 73.200 ( I just noticed I had a /10 division when plotting to graph, and that’s why it looks like 64/65 setps).
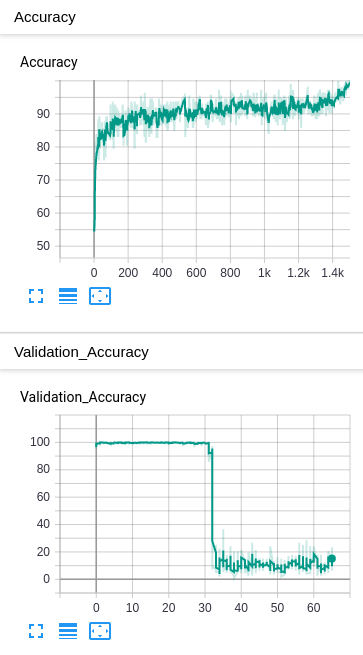
I also found out that I was plotting the top1 value insted of prec1. I do not think this can be the issue, since the average top1 was calculated to be arrount 50%. Nevertheless I will start a test with prec1.val insted of top1.val in a few minutes.
This is what I am doing:
        # measure accuracy and record loss
        prec1 = accuracy(output.data, target, topk=(1, ))
        losses.update(loss.item(), input.size(0))
        top1.update(prec1.item(), input.size(0))

        writer.add_scalar('Validation Loss', loss.item(), globaliter_val)
        writer.add_scalar('Validation Accuracy', top1.val, globaliter_val)

...
def accuracy(output, target, topk=(1,)):
    """Computes the precision@k for the specified values of k"""
    maxk = max(topk)
    batch_size = target.size(0)

    _, pred = output.topk(maxk, 1, True, True)
    pred = pred.t()
    correct = pred.eq(target.view(1, -1).expand_as(pred))

    res = []
    for k in topk:
        correct_k = correct[:k].view(-1).float().sum(0)
        res.append(correct_k.mul_(100.0 / batch_size))
    return res
Update: The change I made to the plot function did not affect the end result.Same shape, but now going to 650 instead of 65.