I want to share some basic tips and tools for debugging CUDA illegal memory access (IMA) for AOT Inductor (AOTI). In the future I might fold this into pytorch docs.
Background
AOT Inductor is part of the PT2 stack, similar to torch.compile, but it produces a compilation artifact that can work in a C++ environment. Another key difference is that errors can happen as a CUDA illegal memory error, which can happen non-deterministically and even appear transient at times. This note discusses a few ways to debug such errors.
0. Sanity checks
Before we dive deep into reliably reproducing the error, it is good to try out some existing debugging flags:
AOTI_RUNTIME_CHECK_INPUTS=1
TORCHINDUCTOR_NAN_ASSERTS=1
These flags take effect at compilation time (more precisely, at codegen time). Just to explain:
AOTI_RUNTIME_CHECK_INPUTS=1checks if the inputs satisfy the same set of guards used during compilation.TORCHINDUCTOR_NAN_ASSERTS=1adds codegen before and after each Inductor’s kernel to check for NaN.
1. Pinpoint the CUDA IMA
Again, one hard part is CUDA IMA error can be non-deterministic. It can happen at different locations, and sometimes not happen at all (though that just means the numerics are silently incorrect). With the following two flags, we can trigger the error deterministically.
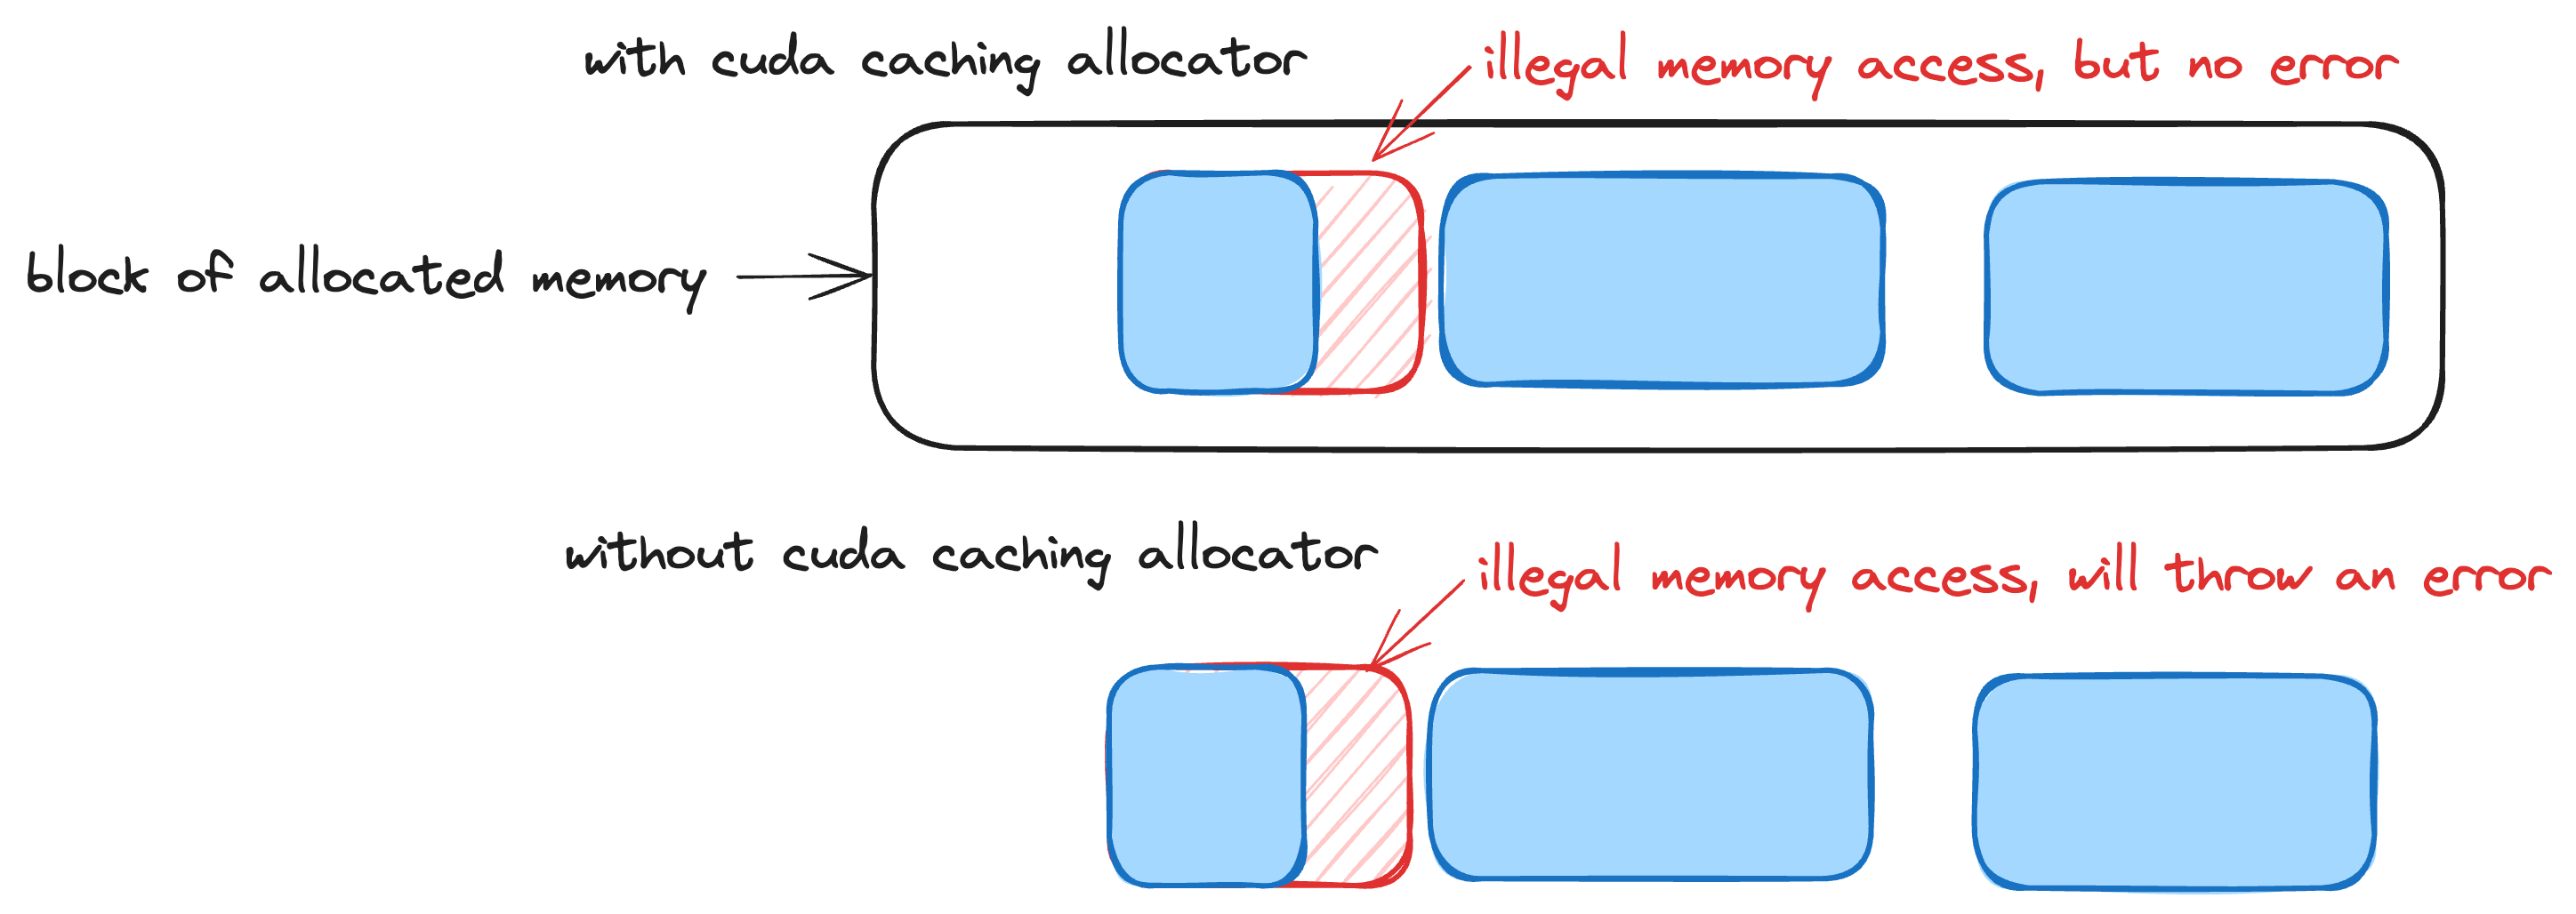
PYTORCH_NO_CUDA_MEMORY_CACHING=1
CUDA_LAUNCH_BLOCKING=1
These flags take effect at runtime. To explain:
PYTORCH_NO_CUDA_MEMORY_CACHING=1disables PyTorch’s Caching Allocator, which allocates a bigger buffer than needed immediately to reduce the number of buffer allocations. This is usually the reason why CUDA illegal memory access errors are non-deterministic.
CUDA_LAUNCH_BLOCKING=1forces the kernels to launch one at a time. Without this, we would get the famous “CUDA kernel errors might be asynchronously reported at some other API call” warning since kernels are launched asynchronously.
2. Identify problematic kernels with Intermediate value debugging
This is a useful tool, developed by Rachel Guo and mentioned in Ed’s blog, to help pinpoint the problematic kernel and get information about the inputs and outputs of said kernel.
We first use
AOT_INDUCTOR_DEBUG_INTERMEDIATE_VALUE_PRINTER=3
which takes effect at compilation time and prints the kernel ones one by one at runtime. Together with the previous flags, this would let us know which kernel was launched right before the error happened.
However, it is important to note that just because the error happened in that kernel, it doesn’t mean that kernel is problematic. For example, it can happen that an earlier kernel is problematic and produces some wrong outputs. So the natural next step is to inspect the inputs to the problematic kernel, which can be done by
AOT_INDUCTOR_FILTERED_KERNELS_TO_PRINT="triton_poi_fused_add_ge_logical_and_logical_or_lt_231,_add_position_embeddings_kernel_5" AOT_INDUCTOR_DEBUG_INTERMEDIATE_VALUE_PRINTER=2
where the filtered kernels to print environment variable has the names of the kernels you want to inspect. If the inputs to the kernel is not as expected, you then inspect the kernel that produces the bad input.
3. Other tools to make debugging easier
It has complete output codes for inspection. It also records the set of guards used.
- TORCH_LOGS=”+inductor,output_code”
To see more PT2 internal logs.
- TORCH_SHOW_CPP_STACKTRACES=1
To potentially see more stack traces.
- Pay attention to dynamic shapes
Historically it has been a source of many IMAs.
- Pay attention to Custom ops
Especially when implemented in C++ and used with dynamic shapes. There is a need to Symint’ify the meta function.