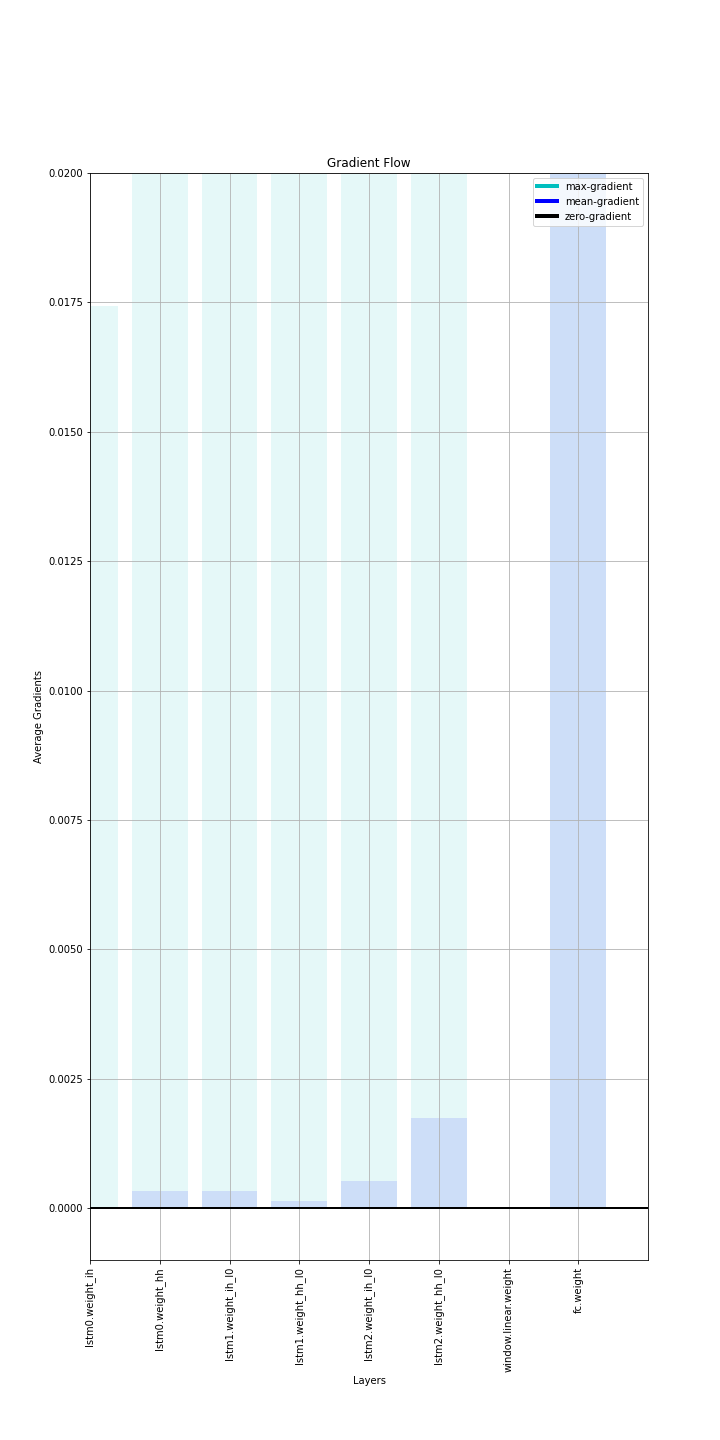
This code is to visualize the “Vanishing gradient Problem”. If you want to visualize when and where the gradients are exploding, you can play around with the top value of plt.ylim.
plt.ylim(bottom = -0.001, top = 0.02)
import torch
import numpy as np
import matplotlib.pyplot as plt
from matplotlib.lines import Line2D
@torch.no_grad()
def plot_grad_flow(named_params, path):

    avg_grads, max_grads, layers = [], [], []
    plt.figure(figsize = ((10,20)))

    for n, p in named_params:

        if (p.requires_grad) and ('bias' not in n):

            layers.append(n)
            avg_grads.append(p.grad.abs().mean())
            max_grads.append(p.grad.abs().max())

    plt.bar(np.arange(len(max_grads)), max_grads, alpha = 0.1, lw = 1, color = 'c')
    plt.bar(np.arange(len(max_grads)), avg_grads, alpha = 0.1, lw = 1, color = 'b')
    plt.hlines(0, 0, len(avg_grads) + 1, lw = 2, color = 'k')
    plt.xticks(range(0, len(avg_grads), 1), layers, rotation = 'vertical')
    plt.xlim(left = 0, right = len(avg_grads))
    plt.ylim(bottom = -0.001, top = 0.02) #Zoom into the lower gradient regions
    plt.xlabel('Layers')
    plt.ylabel('Average Gradients')
    plt.title('Gradient Flow')
    plt.grid(True)
    plt.legend([
        Line2D([0], [0], color = 'c', lw = 4),
        Line2D([0], [0], color = 'b', lw = 4),
        Line2D([0], [0], color = 'k', lw = 4),
        ],
        ['max-gradient', 'mean-gradient','zero-gradient'])

    plt.savefig(path)
    plt.close()
Output: