I have been looking for tools to profile the end-to-end training of a model (reduced epochs, of course), and the profiler torch.utils.bottleneck is returning some strange results.
There is also lots of information it is leaving out, like what runs in parallel and such (comparing to tensorflow profiling tool), so i would love to hear about any other options!
The bottleneck profiler has returned this output;
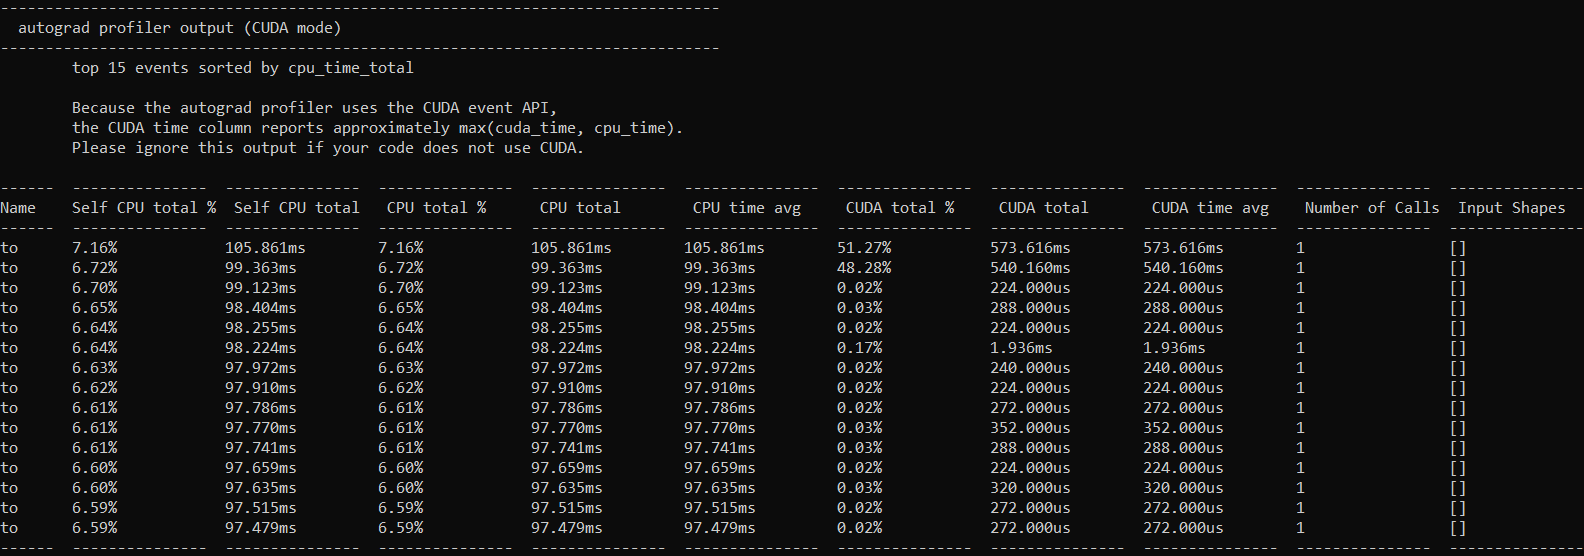
All the functions have the same name, and it is overall a bit difficult to get a clear picture of what the model is doing. I suspect things like the input_shapes being and each function getting called exactly once are signs that something is not quite right, but i have not found much documentation to confirm this suspicion.
Any advice or suggestions would be sincerely appreciated!