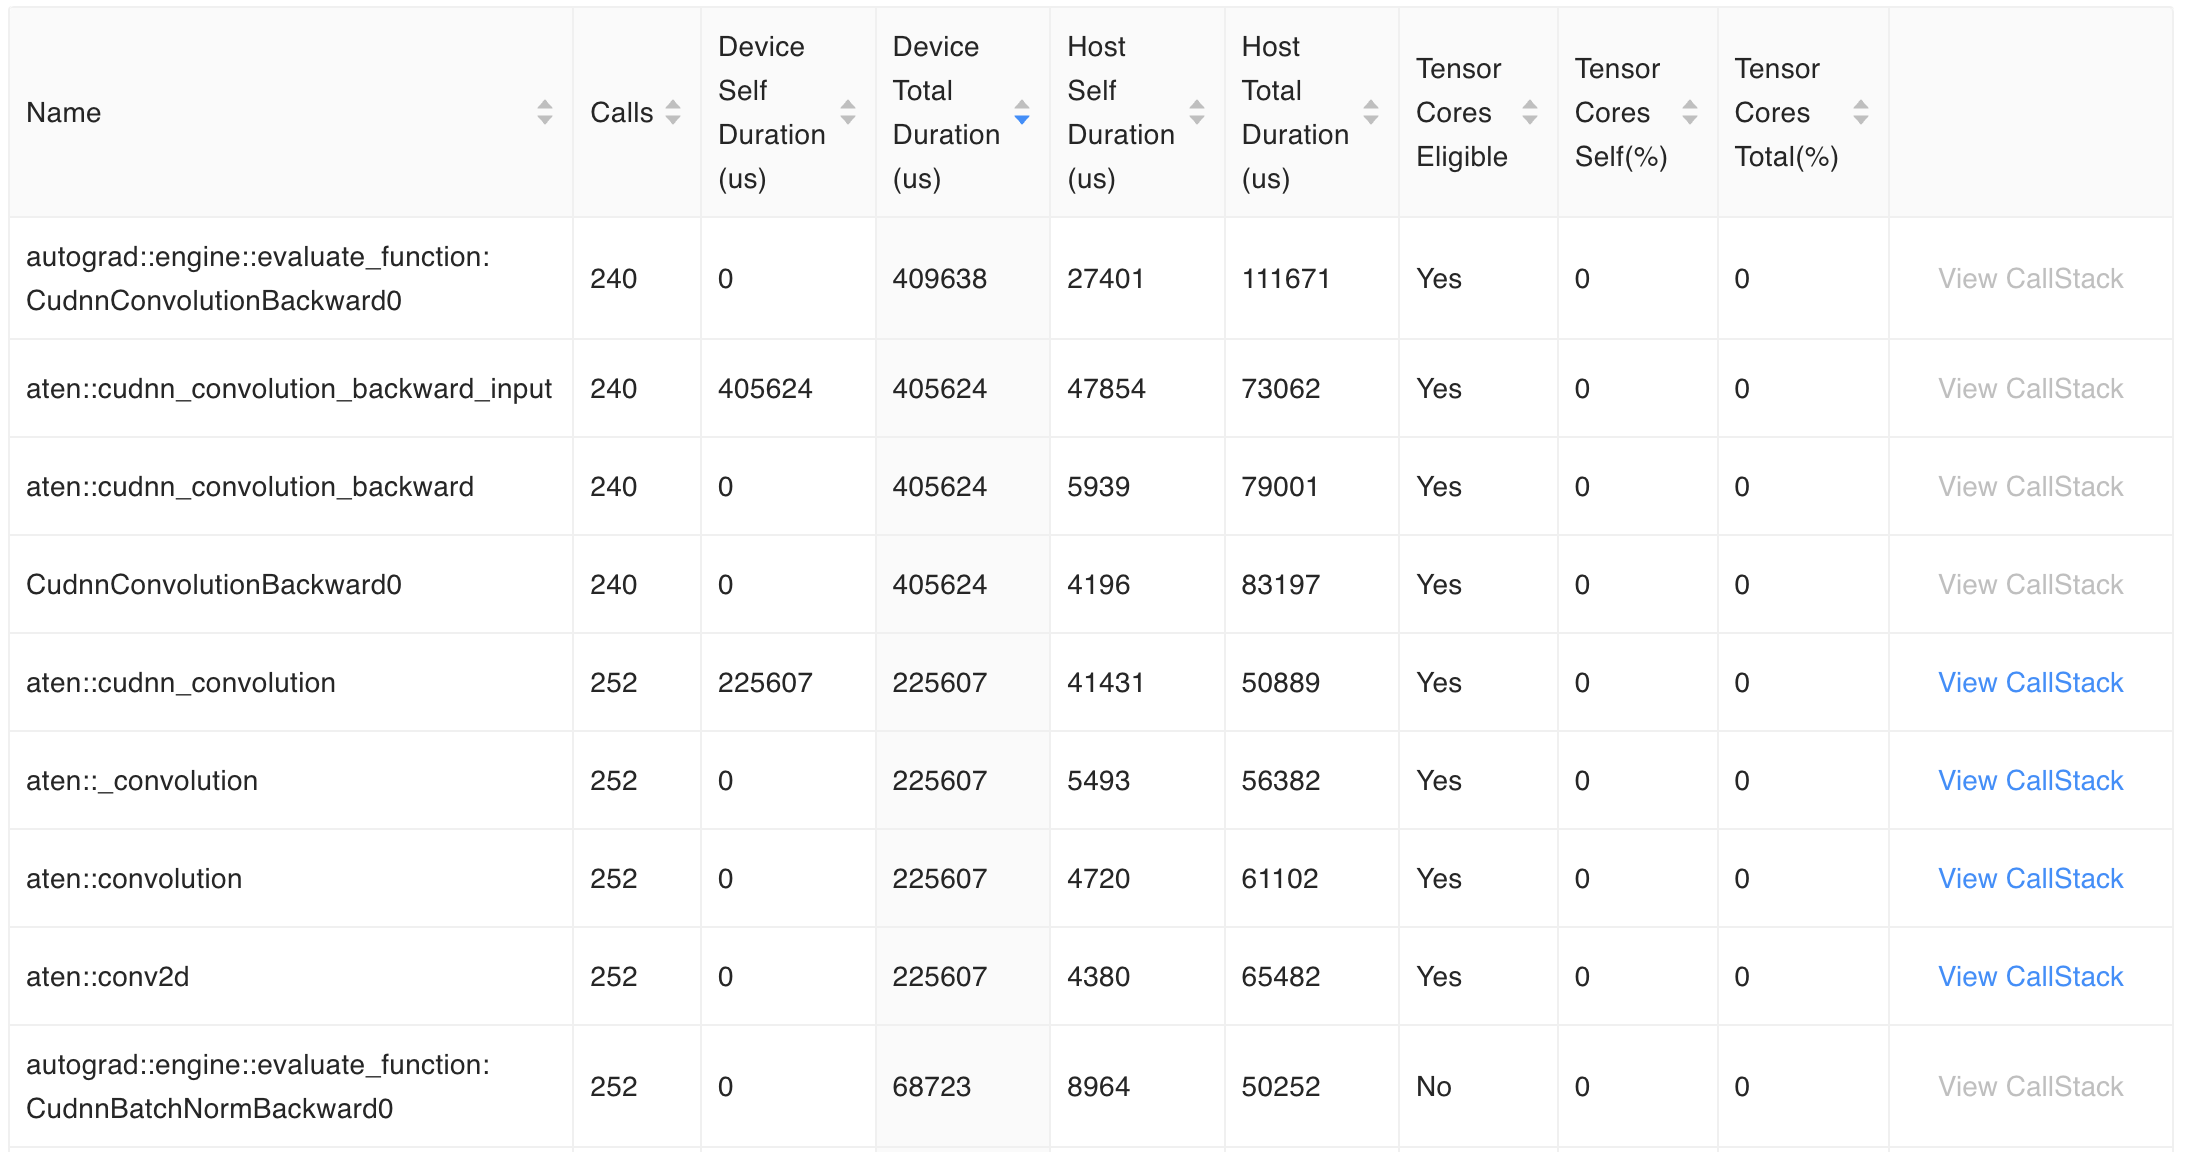
This is my profiling output in tensorboard.
I understand that ‘Device Self Duration’ only counts for the parent class, and ‘Device Total Duration’ counts for the parent and child class combined. However, the output names in ‘Device Total Duration’ confuse me, because there seem to be 8 convolution operations similar yet different to each other. I am guessing they are in a hierarchical relationship with each other, but I’m not sure because I’m new to profiling.
I tried to check the hierarchical relationship by setting with_modules=True, but it does not show anything in the tensorboard visualization. Is there any way to analyze/visualize the hierarchy between the module calls so I can see exactly which operation is the bottleneck?
The top picture is sorted by the ‘Device Total Duration Time’.