Approximating sine function using neural network

Problem

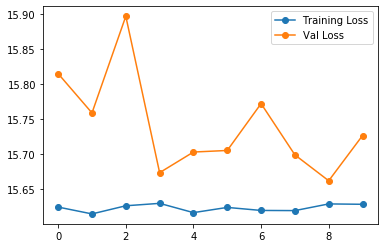
I am trying to build a function approximator using PyTorch. But my neural network does not seem to learn anything.
image

The full executable code is as follows. I am not sure what mistakes I have made. Could someone help me? Thank you in advance.

import torch
import numpy as np

from torch import nn, optim
from torch.nn import functional as F
from torch.utils.data import TensorDataset, DataLoader

from sklearn.model_selection import train_test_split

LR = 1e-6
MAX_EPOCH = 10
BATCH_SIZE = 512

device = torch.device("cuda") if torch.cuda.is_available() else torch.device("cpu")

class SineApproximator(nn.Module):
    def __init__(self):
        super(SineApproximator, self).__init__()
        self.regressor = nn.Sequential(nn.Linear(1, 1024),
                                       nn.ReLU(inplace=True),
                                       nn.Linear(1024, 1024),
                                       nn.ReLU(inplace=True),
                                       nn.Linear(1024, 1))
    def forward(self, x):
        output = self.regressor(x)
        return x

X = np.random.rand(10**5) * 2 * np.pi
y = np.sin(X)

X_train, X_val, y_train, y_val = map(torch.tensor, train_test_split(X, y, test_size=0.2))
train_dataloader = DataLoader(TensorDataset(X_train.unsqueeze(1), y_train.unsqueeze(1)), batch_size=BATCH_SIZE,
                              pin_memory=True, shuffle=True)
val_dataloader = DataLoader(TensorDataset(X_val.unsqueeze(1), y_val.unsqueeze(1)), batch_size=BATCH_SIZE,
                            pin_memory=True, shuffle=True)

model = SineApproximator().to(device)
optimizer = optim.Adam(model.parameters(), lr=LR)
criterion = nn.MSELoss(reduction="mean")

# training loop
train_loss_list = list()
val_loss_list = list()
for epoch in range(MAX_EPOCH):
    print("epoch %d / %d" % (epoch+1, MAX_EPOCH))
    model.train()
    # training loop
    temp_loss_list = list()
    for X_train, y_train in train_dataloader:
        X_train = X_train.type(torch.float32).to(device)
        y_train = y_train.type(torch.float32).to(device)

        optimizer.zero_grad()

        score = model(X_train)
        loss = criterion(input=score, target=y_train)
        loss.requires_grad = True
        loss.backward()

        optimizer.step()

        temp_loss_list.append(loss.detach().cpu().numpy())
    
    temp_loss_list = list()
    for X_train, y_train in train_dataloader:
        X_train = X_train.type(torch.float32).to(device)
        y_train = y_train.type(torch.float32).to(device)

        score = model(X_train)
        loss = criterion(input=score, target=y_train)

        temp_loss_list.append(loss.detach().cpu().numpy())
    
    train_loss_list.append(np.average(temp_loss_list))

    # validation
    model.eval()
    
    temp_loss_list = list()
    for X_val, y_val in val_dataloader:
        X_val = X_val.type(torch.float32).to(device)
        y_val = y_val.type(torch.float32).to(device)

        score = model(X_val)
        loss = criterion(input=score, target=y_val)

        temp_loss_list.append(loss.detach().cpu().numpy())
    
    val_loss_list.append(np.average(temp_loss_list))

    print("\ttrain loss: %.5f" % train_loss_list[-1])
    print("\tval loss: %.5f" % val_loss_list[-1])
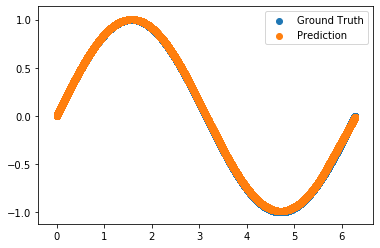
This is a dumb mistake. I wrongly return x instead of output in the forward function. The resulting model could successfully approximate the sine function. As could be seen below, the prediction could perfectly match the sine curve in validation data.
image

1 Like

Hi @MrRobot, I changed the x to output but I get the following error:

epoch 1 / 10
---------------------------------------------------------------------------
RuntimeError                              Traceback (most recent call last)
<ipython-input-12-d02b18943b31> in <module>
     40         score = model(X_train)
     41         loss = criterion(input=score, target=y_train)
---> 42         loss.requires_grad = True
     43         loss.backward()
     44 

RuntimeError: you can only change requires_grad flags of leaf variables.

Could you maybe post the working code please?

loss should already require gradients. Could you check its loss.grad_fn and make sure you see a valid function and not None?
If you are getting a None output, it seems that the computation graph was detached at some point and we would need to check your code.

1 Like

Hi, I tried, if I do:
print("loss.grad_fn: ",loss.grad_fn)
I get this:
loss.grad_fn: <MseLossBackward object at 0x7f9152ca7358>

My code is the same as the one above in which I changed return x with return output

However, the code is below for convenience
I arrive to see only

Debug 5
loss.grad_fn:  <MseLossBackward object at 0x7f9152905b00>
# In[15]:


import torch
import numpy as np

from torch import nn, optim
from torch.nn import functional as F
from torch.utils.data import TensorDataset, DataLoader
from sklearn.model_selection import train_test_split

import matplotlib
import matplotlib.pyplot as plt
import numpy as np


# In[16]:


LR = 1e-6
MAX_EPOCH = 10
BATCH_SIZE = 512

device = torch.device("cuda") if torch.cuda.is_available() else torch.device("cpu")


# In[17]:


class SineApproximator(nn.Module):
    def __init__(self):
        super(SineApproximator, self).__init__()
        self.regressor = nn.Sequential(nn.Linear(1, 1024),
                                       nn.ReLU(inplace=True),
                                       nn.Linear(1024, 1024),
                                       nn.ReLU(inplace=True),
                                       nn.Linear(1024, 1))
    def forward(self, x):
        output = self.regressor(x)
        return output

X = np.random.rand(10**5) * 2 * np.pi
y = np.sin(X)

print(X)
print(np.size(X))
print(y)
print(np.size(y))


# In[18]:


# # Data for plotting
# # t = np.arange(0.0, 2.0, 0.01)
# # s = 1 + np.sin(2 * np.pi * t)

# matplotlib.rcParams['agg.path.chunksize'] = 10000

# fig, ax = plt.subplots()
# ax.plot(X, y)

# # ax.set(xlabel='X', ylabel='y',
# #        title='Test plot')
# # ax.grid()

# # fig.savefig("test.png")
# plt.show()


# In[19]:


class SineApproximator(nn.Module):
    def __init__(self):
        super(SineApproximator, self).__init__()
        self.regressor = nn.Sequential(nn.Linear(1, 1024),
                                       nn.ReLU(inplace=True),
                                       nn.Linear(1024, 1024),
                                       nn.ReLU(inplace=True),
                                       nn.Linear(1024, 1))
    def forward(self, x):
        output = self.regressor(x)
        return output

X = np.random.rand(10**5) * 2 * np.pi
y = np.sin(X)

# Data for plotting
# t = np.arange(0.0, 2.0, 0.01)
# s = 1 + np.sin(2 * np.pi * t)

fig, ax = plt.subplots()
ax.plot(X, y)

ax.set(xlabel='X', ylabel='y',
       title='Test plot')
ax.grid()

# fig.savefig("test.png")
plt.show()

X_train, X_val, y_train, y_val = map(torch.tensor, train_test_split(X, y, test_size=0.2))
train_dataloader = DataLoader(TensorDataset(X_train.unsqueeze(1), y_train.unsqueeze(1)), batch_size=BATCH_SIZE,
                              pin_memory=True, shuffle=True)
val_dataloader = DataLoader(TensorDataset(X_val.unsqueeze(1), y_val.unsqueeze(1)), batch_size=BATCH_SIZE,
                            pin_memory=True, shuffle=True)

model = SineApproximator().to(device)
optimizer = optim.Adam(model.parameters(), lr=LR)
criterion = nn.MSELoss(reduction="mean")

# training loop
train_loss_list = list()
val_loss_list = list()
print("Debug 1")
for epoch in range(MAX_EPOCH):
    print("epoch %d / %d" % (epoch+1, MAX_EPOCH))
    model.train()
    # training loop
    temp_loss_list = list()
    for X_train, y_train in train_dataloader:
        X_train = X_train.type(torch.float32).to(device)
        y_train = y_train.type(torch.float32).to(device)
        print("Debug 2")
        optimizer.zero_grad()
        print("Debug 3")
        score = model(X_train)
        print("Debug 4")
        loss = criterion(input=score, target=y_train)
        print("Debug 5")
        print("loss.grad_fn: ",loss.grad_fn)
        loss.requires_grad = True
        print("Debug 6")
        loss.backward()
        
        optimizer.step()

        temp_loss_list.append(loss.detach().cpu().numpy())
    
    temp_loss_list = list()
    for X_train, y_train in train_dataloader:
        X_train = X_train.type(torch.float32).to(device)
        y_train = y_train.type(torch.float32).to(device)

        score = model(X_train)
        loss = criterion(input=score, target=y_train)

        temp_loss_list.append(loss.detach().cpu().numpy())
    
    train_loss_list.append(np.average(temp_loss_list))

    # validation
    model.eval()
    
    temp_loss_list = list()
    for X_val, y_val in val_dataloader:
        X_val = X_val.type(torch.float32).to(device)
        y_val = y_val.type(torch.float32).to(device)

        score = model(X_val)
        loss = criterion(input=score, target=y_val)

        temp_loss_list.append(loss.detach().cpu().numpy())
    
    val_loss_list.append(np.average(temp_loss_list))

    print("\ttrain loss: %.5f" % train_loss_list[-1])
    print("\tval loss: %.5f" % val_loss_list[-1])
Thanks for your help!

Since you have already a valid grad_fn, you wouldn’t need to use loss.requires_grad = True again.
Do you see any issue, when you’re not calling it?

1 Like

Thanks, it works now.

Now I have the following problems (easy to solve I think). I am trying to understand better the code (below for convenience) and I do not understand what is the difference between the following block:

    temp_loss_list = list()
    for X_train, y_train in train_dataloader:
        X_train = X_train.type(torch.float32).to(device)
        y_train = y_train.type(torch.float32).to(device)
        optimizer.zero_grad()
        score = model(X_train)
        loss = criterion(input=score, target=y_train)
        loss.backward()
        optimizer.step()
        temp_loss_list.append(loss.detach().cpu().numpy())

and this one

  temp_loss_list = list()
    for X_train, y_train in train_dataloader:
        X_train = X_train.type(torch.float32).to(device)
        y_train = y_train.type(torch.float32).to(device)
        score = model(X_train)
        loss = criterion(input=score, target=y_train)
        temp_loss_list.append(loss.detach().cpu().numpy())

they are both present in the main for loop of my code below and in the second one the following lines are not present:

optimizer.zero_grad()
loss.backward()
optimizer.step()

It seems that we are doing twice the same thing but I think I am missing something important.

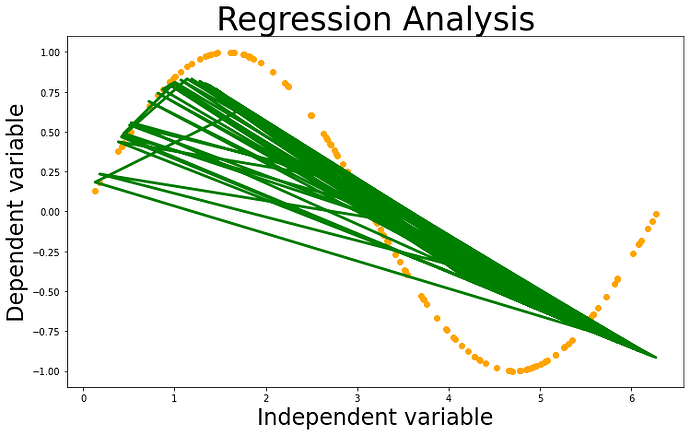
Another problem is that I am trying to plot the fit found from the neural network but I don’t seem to have good results, as you can see in this picture

import torch
import numpy as np

from torch import nn, optim
from torch.nn import functional as F
from torch.utils.data import TensorDataset, DataLoader
from sklearn.model_selection import train_test_split

import matplotlib
import matplotlib.pyplot as plt
import numpy as np


# In[2]:


LR = 1e-6
MAX_EPOCH = 10
BATCH_SIZE = 512

device = torch.device("cuda") if torch.cuda.is_available() else torch.device("cpu")


# In[3]:


# # Data for plotting
# # t = np.arange(0.0, 2.0, 0.01)
# # s = 1 + np.sin(2 * np.pi * t)

# matplotlib.rcParams['agg.path.chunksize'] = 10000

# fig, ax = plt.subplots()
# ax.plot(X, y)

# # ax.set(xlabel='X', ylabel='y',
# #        title='Test plot')
# # ax.grid()

# # fig.savefig("test.png")
# plt.show()


# In[7]:


class SineApproximator(nn.Module):
    def __init__(self):
        super(SineApproximator, self).__init__()
        self.regressor = nn.Sequential(nn.Linear(1, 1024),
                                       nn.ReLU(inplace=True),
                                       nn.Linear(1024, 1024),
                                       nn.ReLU(inplace=True),
                                       nn.Linear(1024, 1))
    def forward(self, x):
        output = self.regressor(x)
        return output

X = np.random.rand(10**5) * 2 * np.pi
y = np.sin(X)

X_train, X_val, y_train, y_val = map(torch.tensor, train_test_split(X, y, test_size=0.2))
train_dataloader = DataLoader(TensorDataset(X_train.unsqueeze(1), y_train.unsqueeze(1)), batch_size=BATCH_SIZE,
                              pin_memory=True, shuffle=True)
val_dataloader = DataLoader(TensorDataset(X_val.unsqueeze(1), y_val.unsqueeze(1)), batch_size=BATCH_SIZE,
                            pin_memory=True, shuffle=True)

model = SineApproximator().to(device)
optimizer = optim.Adam(model.parameters(), lr=LR)
criterion = nn.MSELoss(reduction="mean")

# training loop
train_loss_list = list()
val_loss_list = list()

my_images = []
fig, ax = plt.subplots(figsize=(12,7))

for epoch in range(MAX_EPOCH):
    print("epoch %d / %d" % (epoch+1, MAX_EPOCH))
    model.train()
    ############
    # TRAINING loop
    temp_loss_list = list()
    for X_train, y_train in train_dataloader:
        X_train = X_train.type(torch.float32).to(device)
        y_train = y_train.type(torch.float32).to(device)
        optimizer.zero_grad()
        score = model(X_train)
        loss = criterion(input=score, target=y_train)
        loss.backward()
        optimizer.step()
        temp_loss_list.append(loss.detach().cpu().numpy())
        
    ############
    # PLOTTING 1
    # plot and show learning process
    print("Plotting 1...")
    plt.cla()
    ax.set_title('Regression Analysis', fontsize=35)
    ax.set_xlabel('Independent variable', fontsize=24)
    ax.set_ylabel('Dependent variable', fontsize=24)
    ax.scatter(X_train.data.numpy(), y_train.data.numpy(), color = "orange")
    ax.plot(X_train.data.numpy(), score.data.numpy(), 'g-', lw=3)
    # Used to return the plot as an image array 
    # (https://ndres.me/post/matplotlib-animated-gifs-easily/)
    fig.canvas.draw()       # draw the canvas, cache the renderer
    image = np.frombuffer(fig.canvas.tostring_rgb(), dtype='uint8')
    image  = image.reshape(fig.canvas.get_width_height()[::-1] + (3,))
    my_images.append(image)
    print("...Plotting 1 done!")
    ############
        
    temp_loss_list = list()
    for X_train, y_train in train_dataloader:
        X_train = X_train.type(torch.float32).to(device)
        y_train = y_train.type(torch.float32).to(device)
        score = model(X_train)
        loss = criterion(input=score, target=y_train)
        temp_loss_list.append(loss.detach().cpu().numpy())
    
    train_loss_list.append(np.average(temp_loss_list))
   
    
    # validation
    model.eval()
    
    temp_loss_list = list()
    for X_val, y_val in val_dataloader:
        X_val = X_val.type(torch.float32).to(device)
        y_val = y_val.type(torch.float32).to(device)

        score = model(X_val)
        loss = criterion(input=score, target=y_val)

        temp_loss_list.append(loss.detach().cpu().numpy())
    
    val_loss_list.append(np.average(temp_loss_list))

    print("\ttrain loss: %.5f" % train_loss_list[-1])
    print("\tval loss: %.5f" % val_loss_list[-1])


# save images as a gif 
print("Plotting...")
# If you are in a jupyter notebook this will not show you a gif but just the last image (the gif is saved in the file specified below)
imageio.mimsave('./curve_1.gif', my_images, fps=10)

Thanks for the help.

The first code block trains the model, while the second one only appends the loss to temp_loss_list.
I’m not sure why you would need the second code block, since you are also using a validation loop (which is correct).

Regarding the weird plot output: I would suggest to check the shape of the array you would like to plot, as it seems as matplotlib might interpret the input array differently than what you expect.
In particular the shapes of X_train and score would be interesting to see.

PS: You shouldn’t use the .data attribute, as it might yield unwanted side effects. It should be fine in your code snippet, but I would generally advice to skip the .data usage completely. :wink:

1 Like

Thanks, I will look into this.

What do you suggest instead of the .data attribute?

You should use the tensor directly and wrap it into a with torch.no_grad() block, if you don’t want Autograd to track this operation.

I changed my code to

    with torch.no_grad():
        ax.scatter(X_train.detach().numpy(), y_train.detach().numpy(), color = "orange")
        ax.plot(X_train.detach().numpy(), score.detach().numpy(), 'g-', lw=3)

I hope that this is what you meant.

1 Like

I find your problem interesting so I wrote my own solution for this, and it’s working fine. Check it out here: