Hi folks,
I wanted to experiment with asynchronous data loading to overlap the data transfer time with GPU compute workload. I used multiple data loader workers with a prefetch factor of 4 and I used non-blocking data transfer to copy data from cpu to gpu. Here is my code
def async_data_loading():
    """copying data to gpu asynchronously"""
    size = 1 << 10
    batch_size = 1 << 4
    dim = 1 << 10
    input_list = [torch.randn(dim, dim) for _ in range(size)]

    # mp.set_start_method("spawn")
    dl = torch.utils.data.DataLoader(
        input_list,
        batch_size=batch_size,
        collate_fn=collate_fn,
        pin_memory=True,
        num_workers=4,
        prefetch_factor=4,
        persistent_workers=True,
    )
    f = nn.Linear(dim, dim).cuda()

    for i, batch in enumerate(dl, 1):
        if i > 5:  # warmup
            torch.cuda.cudart().cudaProfilerStart()

        batch = batch.cuda(non_blocking=True)
        range_push("forward")
        f(batch)
        range_pop()

    torch.cuda.cudart().cudaProfilerStop()
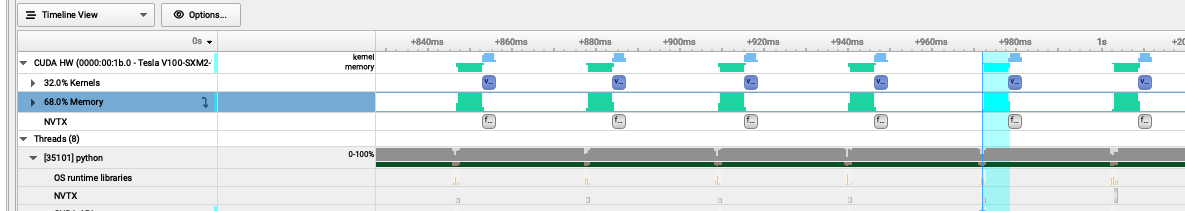
After I ran the code with nsys, I see huge bubbles from the profiler
Based on your code snippet it seems you are directly using the batch in the next line of code (i.e. in the forward pass of your model) after moving it to the GPU. In this case there won’t be any operation to overlap the data transfer since the data would directly be needed. You might also want to profile the DataLoader and check if it’s the current bottleneck in your code creating these idle times.
do you think it is causing the white space between memory + kernel regions? My understanding is that by setting a high prefetch factor, you can overlap the collating with computation. Also, I tried to record it with nvtx as you can see from the commented out part of the function, but the data_loading section didn’t show up in the profile
I’m unsure which part of your data loading pipeline could be the bottleneck.
Not necessarily, since the prefetch_factor defined the size of the queue new batches will be pushed into. The workers (used via num_workers>=1) are already preloading the data in the background. However, if they are already too slow and cannot keep up with the actual training loop, increasing the prefetch_factor won’t help since the queue will be empty most of the time.
However, if they are already too slow and cannot keep up with the actual training loop, increasing the prefetch_factor won’t help since the queue will be empty most of the time.
That makes sense. And I suppose increasing num_workers wont help. I tried different values for num_workers and didn’t see the improvement. I’d like to understand more on how workers are being used to create a batch.
Was the marker entirely missing in the profile?
Yeah, that’s right. In the nvtx section, I only see forward being recorded.
I don’t know why it’s not working for you as I cannot reproduce the issue using this simple example:
import torch
from torch.utils.data import TensorDataset, DataLoader

# simple use case
def my_collate(batch):
    torch.cuda.nvtx.range_push("collate_fn")
    x = torch.stack([a for a, b in batch])
    y = torch.stack([b for a, b in batch])
    torch.cuda.nvtx.range_pop()
    return x, y

device = "cuda"
dataset = TensorDataset(torch.arange(10).to(device), torch.arange(10, 20).to(device))
loader = DataLoader(dataset, batch_size=5, collate_fn=my_collate)

torch.cuda.nvtx.range_push("loader loop")
for data, target in loader:
    print(data, target)
torch.cuda.nvtx.range_pop()
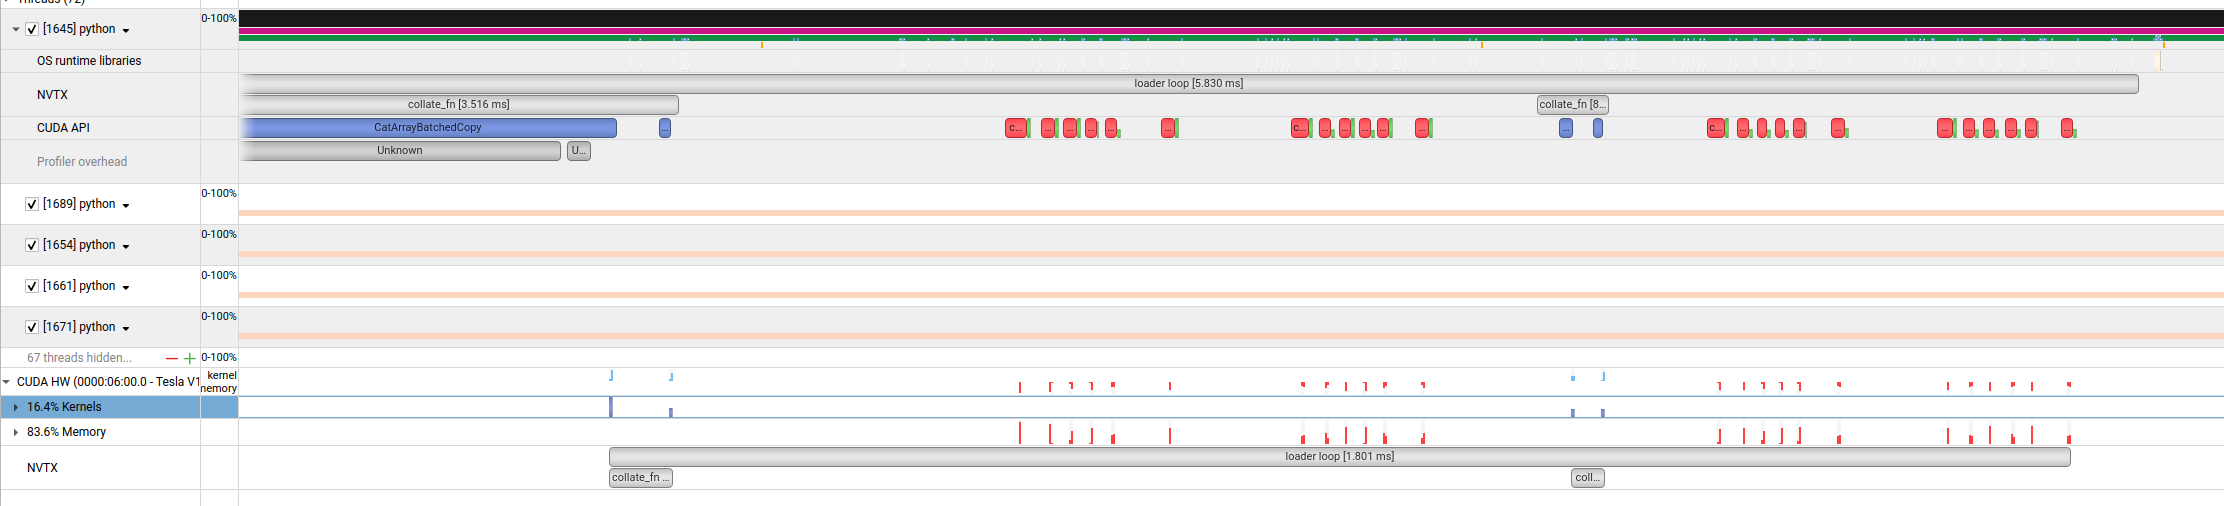
The profile shows the loader loop as well as the collate_fn ranges:
My profile was created using just nsys profile python tmp.py and I’m using Nsight Systems 2024.1.1 with a current PyTorch build from source. Which setup are you using?
I’m using nsys 2023.3.1 and pytorch 2.1.0. They are both in a docker image and I believe it is based on a recent Nvidia PyTorch image. Sorry that I cannot be more precise, there are too many layers of teams between me and the image I am using