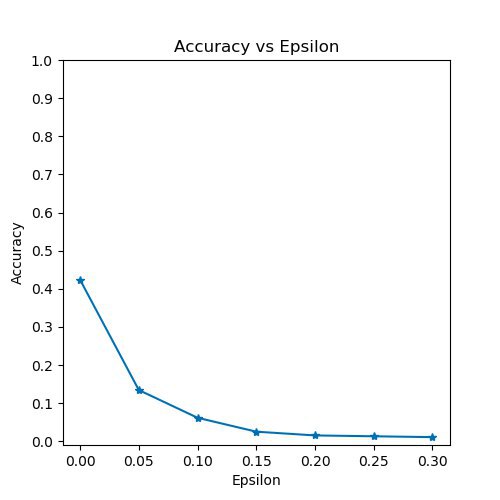
@ptrblck, Hi!
I’m trying to visualize the adversarial images generated by this script:
https://pytorch.org/tutorials/beginner/fgsm_tutorial.html
This tutorial is used for the mnist data. Now I want to use for other data which is trained using the inception_v1 architecture, below is the gist for that one:
from __future__ import print_function
import torch
import torch.nn as nn
import torch.nn.functional as F
import torch.optim as optim
from torchvision import datasets, models, transforms
import numpy as np
import matplotlib.pyplot as plt
import os


epsilons = [0, .05, .1, .15, .2, .25, .3]
pretrained_model = "googlenet/googlenet_aux03_ep30.pth"
use_cuda=True

Net = models.googlenet()

#Even if set aux_logits to False, the state_dict throws the unexpected aux arguments.
num_ftrs = Net.aux2.fc2.in_features
Net.aux2.fc2 = nn.Linear(num_ftrs, 5)

num_ftrs = Net.fc.in_features
Net.fc = nn.Linear(num_ftrs, 5)


test_loader = torch.utils.data.DataLoader(
            datasets.ImageFolder(os.path.join('data/val'), transform=transforms.Compose([
                 transforms.Resize(224),
                 transforms.RandomCrop(224),
                 transforms.ToTensor(),
                 transforms.Normalize([0.485, 0.456, 0.406], [0.229, 0.224, 0.225])
            ])),
               batch_size=1, shuffle=True)


print("CUDA Available: ",torch.cuda.is_available())
device = torch.device("cuda:1" if (use_cuda and torch.cuda.is_available()) else "cpu")

model = Net.to(device)

model.load_state_dict(torch.load(pretrained_model, map_location='cpu'))

model.eval()

def fgsm_attack(image, epsilon, data_grad):
    # Collect the element-wise sign of the data gradient
    sign_data_grad = data_grad.sign()
    # Create the perturbed image by adjusting each pixel of the input image
    perturbed_image = image + epsilon*sign_data_grad
    # Adding clipping to maintain [0,1] range
    perturbed_image = torch.clamp(perturbed_image, 0, 1)
    # Return the perturbed image
    return perturbed_image


def test( model, device, test_loader, epsilon ):

    # Accuracy counter
    correct = 0
    adv_examples = []

    # Loop over all examples in test set
    for data, target in test_loader:

        # Send the data and label to the device
        data, target = data.to(device), target.to(device)

        # Set requires_grad attribute of tensor. Important for Attack
        data.requires_grad = True

        # Forward pass the data through the model
        output = model(data)
        init_pred = output.max(1, keepdim=True)[1] # get the index of the max log-probability

        # If the initial prediction is wrong, dont bother attacking, just move on
        if init_pred.item() != target.item():
            continue

        # Calculate the loss
        loss = F.nll_loss(output, target)

        # Zero all existing gradients
        model.zero_grad()

        # Calculate gradients of model in backward pass
        loss.backward()

        # Collect datagrad
        data_grad = data.grad.data

        # Call FGSM Attack
        perturbed_data = fgsm_attack(data, epsilon, data_grad)

        # Re-classify the perturbed image
        output = model(perturbed_data)

        # Check for success
        final_pred = output.max(1, keepdim=True)[1] # get the index of the max log-probability
        if final_pred.item() == target.item():
            correct += 1
            # Special case for saving 0 epsilon examples
            if (epsilon == 0) and (len(adv_examples) < 5):
                adv_ex = perturbed_data.squeeze().detach().cpu().numpy()
                adv_examples.append( (init_pred.item(), final_pred.item(), adv_ex) )
        else:
            # Save some adv examples for visualization later
            if len(adv_examples) < 5:
                adv_ex = perturbed_data.squeeze().detach().cpu().numpy()
                adv_examples.append( (init_pred.item(), final_pred.item(), adv_ex) )

    # Calculate final accuracy for this epsilon
    final_acc = correct/float(len(test_loader))
    print("Epsilon: {}\tTest Accuracy = {} / {} = {}".format(epsilon, correct, len(test_loader), final_acc))

    # Return the accuracy and an adversarial example
    return final_acc, adv_examples


accuracies = []
examples = []

# Run test for each epsilon
for eps in epsilons:
    acc, ex = test(model, device, test_loader, eps)
    accuracies.append(acc)
    examples.append(ex)


plt.figure(figsize=(5,5))
plt.plot(epsilons, accuracies, "*-")
plt.yticks(np.arange(0, 1.1, step=0.1))
plt.xticks(np.arange(0, .35, step=0.05))
plt.title("Accuracy vs Epsilon")
plt.xlabel("Epsilon")
plt.ylabel("Accuracy")
plt.show()


cnt = 0
plt.figure(figsize=(8,10))
for i in range(len(epsilons)):
    for j in range(len(examples[i])):
        cnt += 1
        plt.subplot(len(epsilons),len(examples[0]),cnt)
        plt.xticks([], [])
        plt.yticks([], [])
        if j == 0:
            plt.ylabel("Eps: {}".format(epsilons[i]), fontsize=14)
        orig,adv,ex = examples[i][j]
        ex = ex.numpy().transpose((1, 2, 0))
        mean = np.array([0.485, 0.456, 0.406])
        std = np.array([0.229, 0.224, 0.225])
        ex = std * ex + mean
        ex = np.clip(ex, 0, 1)
        #ex = ex.permute(1, 2, 0)
        plt.title("{} -> {}".format(orig, adv))
        plt.imshow(ex)
plt.tight_layout()
plt.show()
Upto the accuracy graph, the code ran well, but for the visualizing images it throws this error:
Traceback (most recent call last):
  File "fgsm.py", line 156, in <module>
    ex = ex.numpy().transpose((1, 2, 0))
AttributeError: 'numpy.ndarray' object has no attribute 'numpy'
any thoughts?


