Hi,
I’m using torch.profiler to profile both forward and backward in my code. I also use the Tensorboard plugin (I know its deprecated) and Chrome trace to visualize the result.
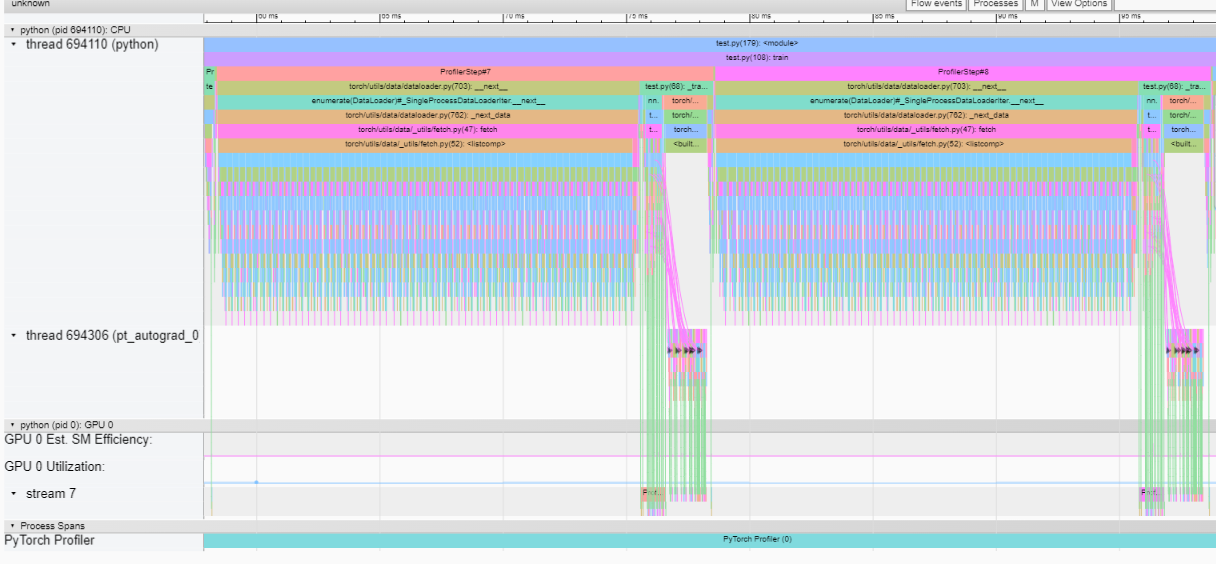
Here is the result of profiling two steps of my training function:
As you can clearly see, there are three traces: main process, the autograd process, and the GPU process.
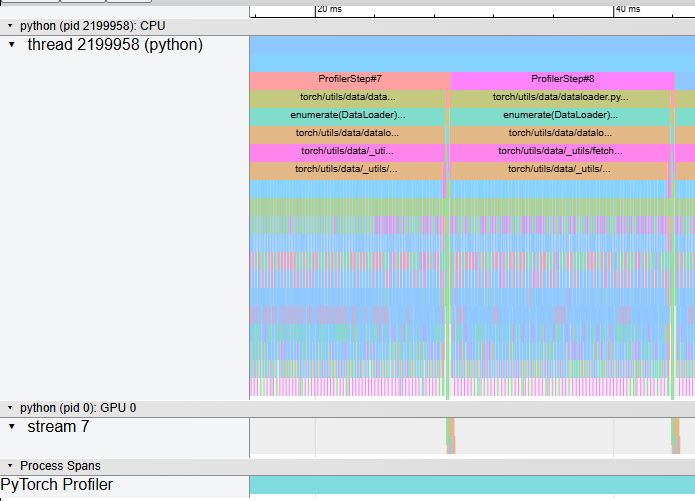
However, the trace of autograd process disappears when I use CUDA graph.
My code uses torch.cuda.CUDAGraph() to manually build a CUDA graph of my training code (both forward and backward including optimizer). However, that somehow eliminates the
Question: Is this expected or is it a bug? I understand CUDA graphs launches a series of CUDA kernels at once, but why would this eliminate the entire autograd process?
I would expect this behavior since you are capturing the kernel launches and let the device execute it via cudaGraphLaunch. In PyTorch Eager the host launches the kernel from the main and backward thread.
Hi @ptrblck, thanks for your reply!
I see. So let me get this straight. Are you saying there is NO backward thread running at all when I use CUDA graph or the profiler simply doesn’t show the thread?
Also, the profiler trace doesn’t show GPU Est. SM Efficiency and Utilization when I use CUDA graph like the eager mode (both Chrome trace and Tensorboard). Is this expected?
Thanks for your help!
Since you are launching a single CUDAGraph, no host thread is involved in any other launches which is one of the main advantages of using CUDAGraphs.
I’m not deeply familiar with the native profiler visualization in chrome and use Nsight Systems most of the time, so don’t know if these attributes are expected to be missing.