During testing phase I noticed that in every model I have tested so far, after increasing batch_size training time increases too. Is it even possible? Maybe I am missing something in code?
Are you checking the iteration or epoch time?
The interesting performance would be given as e.g. samples/second not the iteration time itself.
I was checking execution time of 5 epochs and it seemed weird that when I was trying to use all of my gpu memory, it was actually working twice slower than 1/4 max batch size. I do not mean it was learning slower, just the execution time of epoch. I dont know is that even an error, as far as I understand larger batches means squeezing more samples and averaging their losses to backtrack all of them at once, so theoretically larger batch should leads to shorten execution time. And batch_size=1 needs actually more time to do one epoch than batch_size=32, but although i have more memory in gpu the more I increase batch size from some point, the more its slowing down. I’m worried its because my hardware or some problem in code and Im not sure should it works like that.
Here are some of my results during ShuffleNet V2 x0.5 training:
Fine tuning / num_workers: 4 / Optimizer: SGD / Loss: Cross Entropy / Data Augmentation: Rotate, Horizontal and Vertical Flip / Outputs: 3 / Input size: 224x224 / Epochs: 5 / Dataset size: 1500
Batch size: 1 | Training time: 184 s | Gpu usage: 1462 MB
Batch size: 142 | Training time: 39 s | Gpu usage: 3591 MB
Batch size: 284 | Training time: 47 s | Gpu usage: 5629 MB
Batch size: 424 | Training time: 53 s | Gpu usage: 7523 MB
Batch size: 566 | Training time: 56 s | Gpu usage: 7770 MB
As u can see increasing batch size also increases total training time and this pattern is duplicated with other models.
Thanks for the update. To further isolate the bottleneck, you could remove the data loading part and use pre-allocated tensors in the posted batch sizes and profile the code again.
If you are seeing the expected speedup, the bottleneck might be coming from the data loading itself.
Thanks for Your answer!
As u suggested, I changed getitem function in Dataloader class to something like this:
self.tensor = torch.ones((3, 224, 224))

    def __getitem__(self, idx):
        """imagePath = self.new_dataset + self.imgs[idx]["path"]
        image = Image.open(imagePath)
        image = self.transform(image)
        imageClass = self.imgs[idx]["label"]
        label = self.classes.index(imageClass)
        return image, label"""
        return self.tensor,2
But unfortunately the results are the same as before. Increasing batch size still increases total training time. Here are some tested examples.
ShuffleNet V2 x0.5:
Batch size: 142 | Training time: 16,15 s |
Batch size: 284 | Training time: 16,71 s |
Batch size: 424 | Training time: 16,85 s |
Batch size: 560 | Training time: 17,15 s |
MobileNet V3 Small:
Batch size: 96 | Training time: 16,78 s |
Batch size: 194 | Training time: 16,91 s |
Batch size: 290 | Training time: 17,11 s |
Batch size: 386 | Training time: 17,61 s |
Maybe it’s not even an error, but I thought that bigger batch size always decreases execution time.
Yes, your assumption is correct as the performance measures in samples/sec should increase in the optimal case and the epoch time should thus be lower, as seen in e.g. Efficientnet-b0.
To further isolate the bottlenecks, you could profile the code with e.g Nsight Systems.
I used Pytorch profiler to profile training and tensorboard to make it looking cleaner. I have tested densenet121 with batch_size 20 and 60. Here are some graphs that profiler has created.
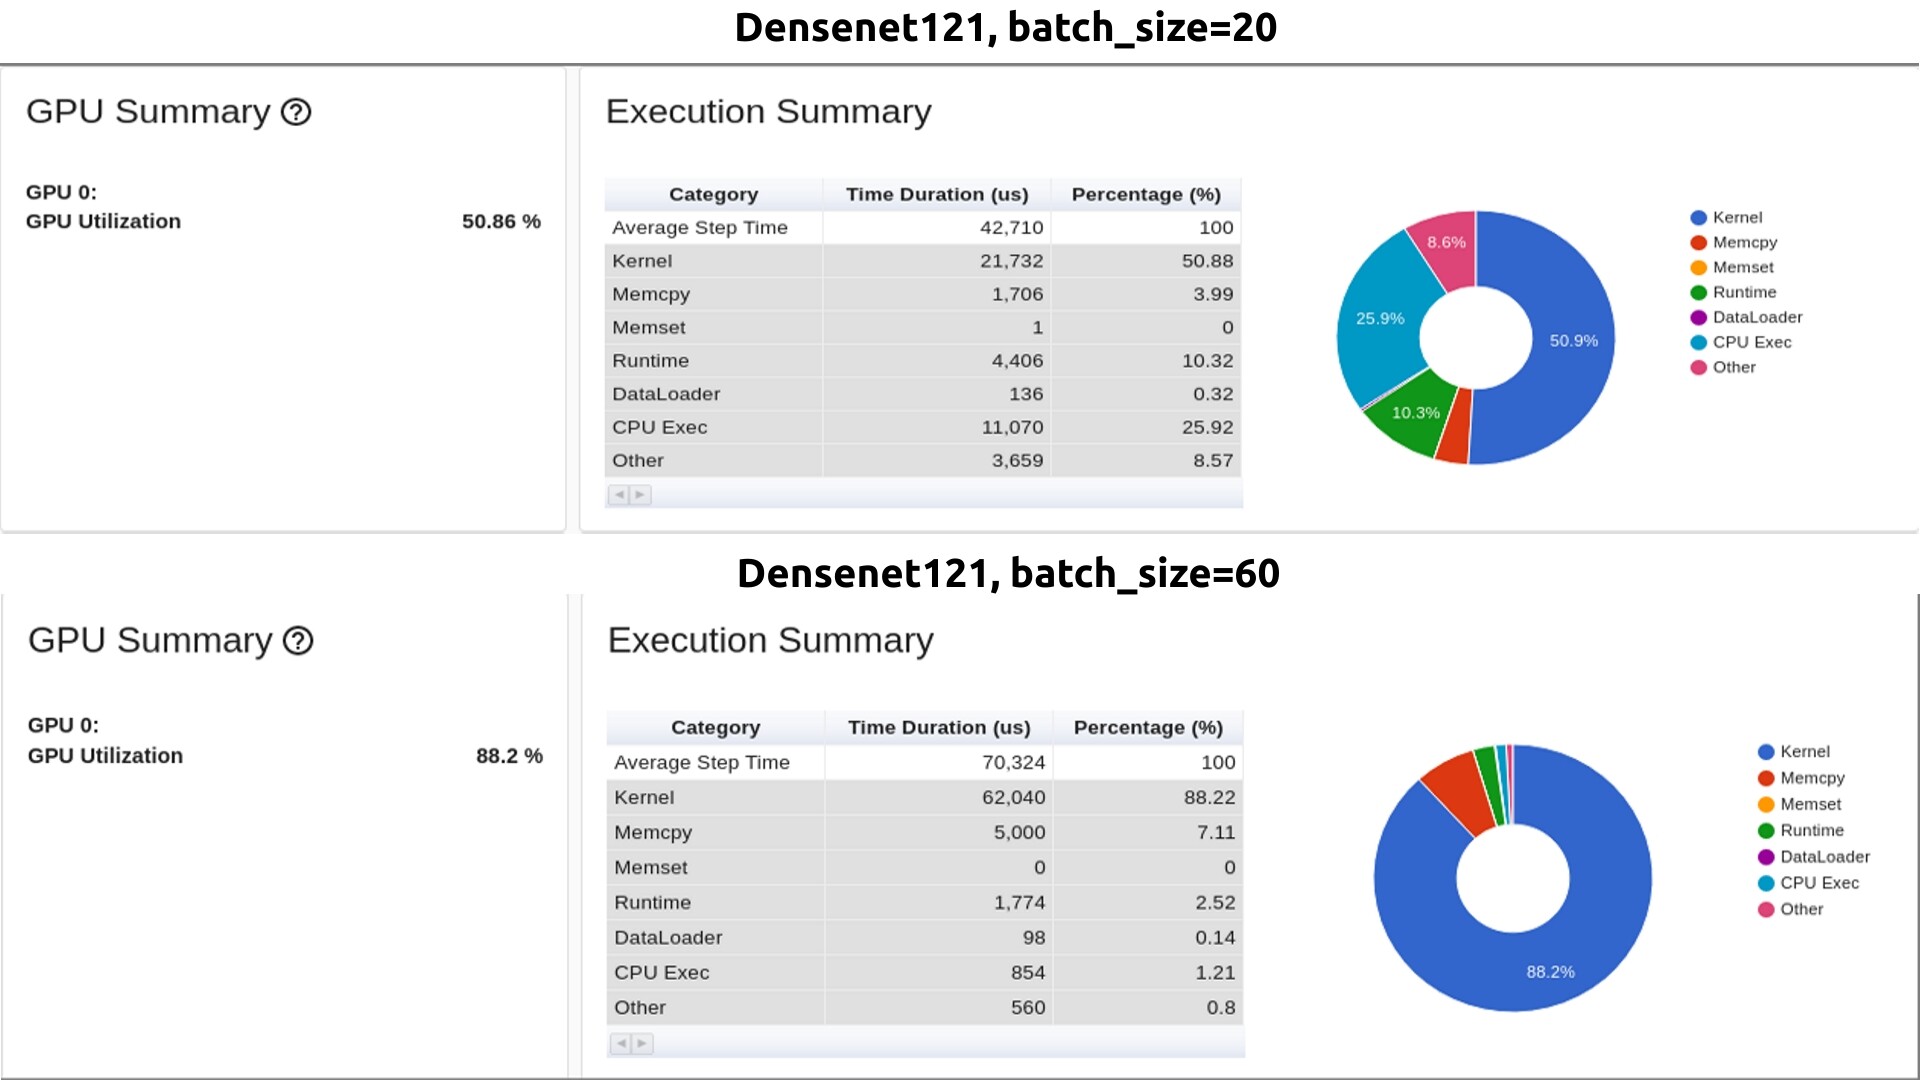
And as you can see, for batch_size=20 GPU usage was around 50% and average step time was almost two times faster than average step time for batch_size=60, even though the GPU consumption was lower, which confuses me.
Logs shows that kernel (which as far as I understand is GPU) takes the biggest part of time and I don’t know whats the problem. If its not I/O that take time, neither data augmentation, why its still remains slower for bigger batches?
As previously described, it’s expected that the kernel times for larger batches take more time (as more work has to be done), but the epoch time should decrease, since more samples/sec should be processed.
Based on the posted profiles:
-
Densenet121: (20 / 42.710) = 0.468
-
Densenet121: (60 / 70.324) = 0.853
-
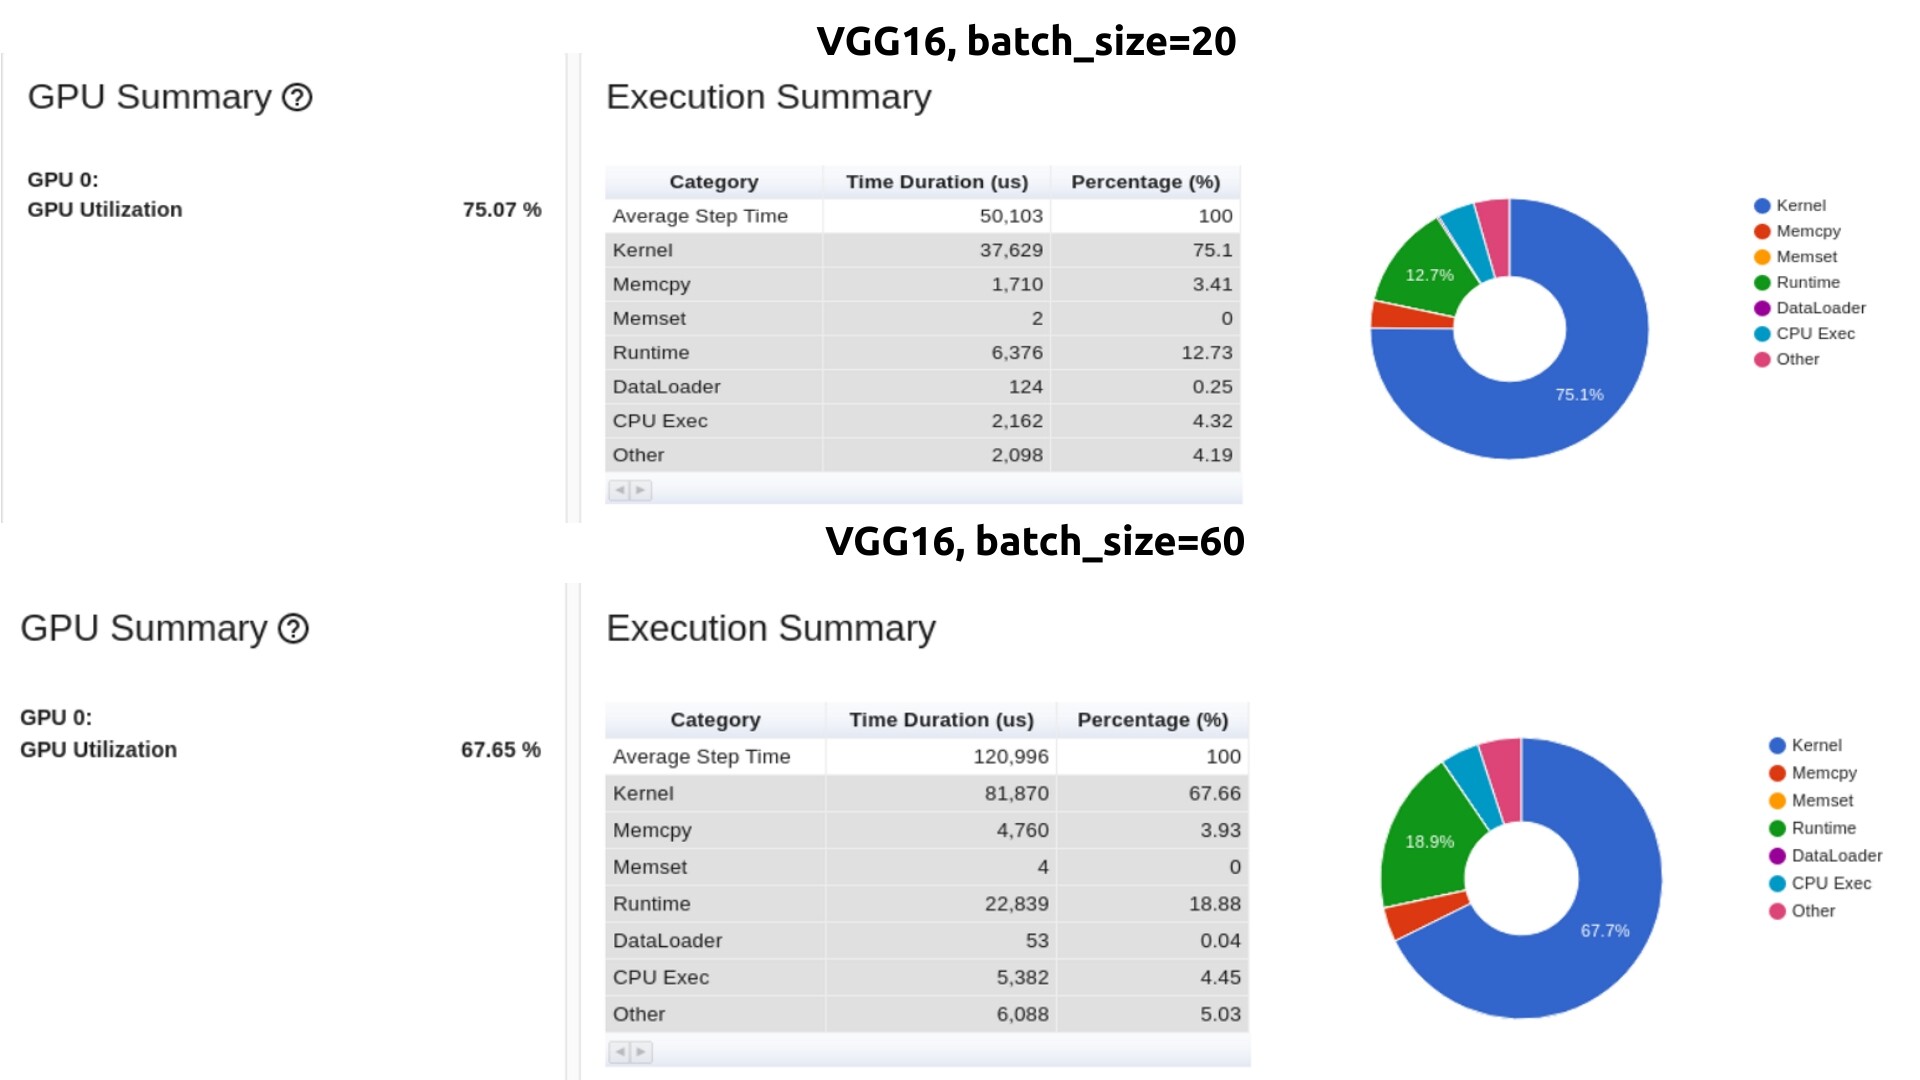
VGG16: (20 / 50.103) = 0.399
-
VGG16: (60 / 120.996) = 0.495
so in both cases increasing the batch size should yield a higher throughput measured in samples/sec (or us in this case) assuming the profile is correct.
I did more tests to isolate the bottleneck even more. This time I changed code a little bit to navigate the times manually. Here is train function code:
def train(self, dataloader, model, loss_func, optimizer):

    train_time = time.time()
    data_time = time.time()
    total_data_time = 0
    total_pred_time = 0
    total_loss_time = 0
    total_zero_grad_time = 0
    total_backward_time = 0
    total_step_time = 0
    total_sample_time = 0

    for batch, (imgs, labels) in enumerate(dataloader):
        total_data_time += time.time() - data_time
        sample_time = time.time()

        imgs, labels = imgs.to(self.device), labels.to(self.device)

        pred_time = time.time()
        predictions = model(imgs)
        total_pred_time += time.time() - pred_time

        loss_time = time.time()
        loss = loss_func(predictions, labels)
        total_loss_time += time.time() - loss_time

        zero_grad_time = time.time()
        optimizer.zero_grad()
        total_zero_grad_time += time.time() - zero_grad_time

        backward_time = time.time()
        loss.backward()
        total_backward_time += time.time() - backward_time

        step_time = time.time()
        optimizer.step()
        total_step_time += time.time() - step_time

        total_sample_time += time.time() - sample_time
        data_time = time.time()

    print(f"Dataset: {len(dataloader.dataset)}")
    print(f"Dataloader: {len(dataloader)}")
    print(f"Train time: {time.time() - train_time} s")
    print(f"Sample time: {total_sample_time} s")
    print(f"Data time: {total_data_time} s")
    print(f"Pred time: {total_pred_time} s")
    print(f"Loss time: {total_loss_time} s")
    print(f"Zero time: {total_zero_grad_time} s")
    print(f"Backward time: {total_backward_time} s")
    print(f"Step time: {total_step_time} s")
I did two tests on ShuffleNet V2 x0.5 with batch size 142 and 566. I chose this model because the dependence on it is the most visible. Here are the results:
For batch_size=566:
Dataset: 1188
Dataloader: 3
Train time: 4.74889 s
Total Sample time: 0.20170 s
Total Data time: 4.49197 s
Total Prediction time: 0.06613 s
Total Loss time: 0.00386 s
Total ZeroGrad time: 0.00027 s
Total Backward time: 0.00483 s
Total Step time: 0.00048 s
For batch_size=142:
Dataset: 1188
Dataloader: 9
Train time: 2.70721 s
Total Sample time: 0.20925 s
Total Data time: 2.44183 s
Total Prediction time: 0.09259 s
Total Loss time: 0.00435 s
Total ZeroGrad time: 0.00082 s
Total Backward time: 0.00579 s
Total Step time: 0.00109 s
I named it data time, but I dont know for sure whats going on between one iteration and another. I suspect its time of loading single batch from dataloader, but then why profiler shows it’s only small part of time?
CUDA operations are executed asynchronously, so you would have to synchronize the code via torch.cuda.synchronize() before starting and stopping the timers. Alternatively, you might want to use torch.utils.benchmark, which would add warmup iterations and synchronize for you.
@Norbert_Szorc * Have you solved your problem? I had the same problem ![]()
Nah, we weren’t able to fix that problem ![]() It was a project that company gave as for an internship program, so after one month we just shared the results with them and dropped it.
It was a project that company gave as for an internship program, so after one month we just shared the results with them and dropped it.
I encoutered the some problem. Solved by increasing num_worker in dataloader to 10, or even more.
@tao_wang2 @Leo_Huang Have you all been able to solve this issue. Whenever I increase my batch size my iteration speed is dropping and also the time for an epoch is increasing. I even tried increasing the number of workers. Still it’s not showing any significant change.
My case is my bottleneck is loading the data from disk. Therefore increasing num worker solved the problem for me. Sometimes I preload all data into mem, and if the size fit, it always help the speed
I also tried this approach still didn’t gave any improvement. I am working using transformers architecture. I am also wondering whether its because of the model architecture by itself.