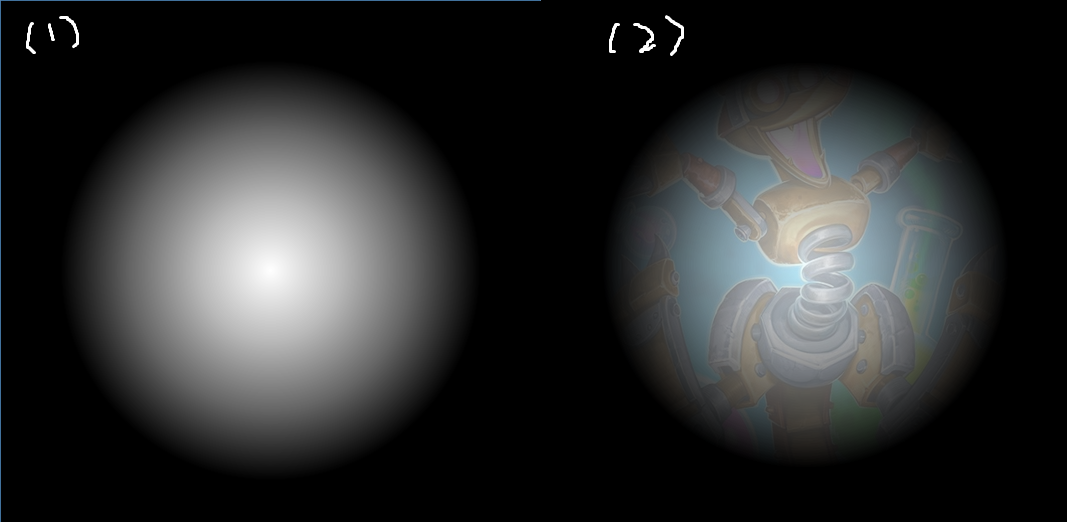
I’m not sure, how you are creating the first image, but if that’s just a multivariate normal distribution, you could use scipy for it.
Here is a dummy code:
from PIL import Image
from scipy.stats import multivariate_normal
import matplotlib.pyplot as plt
import numpy as np


# Create multivariate normal
x, y = np.mgrid[-1:1:.01, -1:1:.01]
pos = np.empty(x.shape + (2,))
pos[:, :, 0] = x
pos[:, :, 1] = y
rv = multivariate_normal(mean=[0., 0.], cov=[[0.1, 0.], [0., 0.1]])
pdf = rv.pdf(pos)
plt.contourf(x, y, pdf)

# Open image
img = Image.open(IMAGE_PATH)
img = img.resize(x.shape)

# Blend both images
img_arr = np.array(img)
img_blend = img_arr * pdf[:, :, None]
img_blend = img_blend / img_blend.max()
plt.imshow(img_blend)
The covariance matrix will scale the size of your normal distribution.
Setting it to a lower value basically makes to “visible window” smaller in your use case.
It doesn’t seem like a PyTorch specific question or would you like to create the multivariate normal using PyTorch or a model?