I have got this graph while training my NN, but I am not getting whether I am doing right or not? Shall I consider the final result or this dip will create problem in analysis. Please guide.
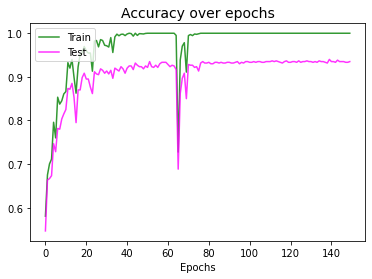
I have got this graph while training my NN, but I am not getting whether I am doing right or not? Shall I consider the final result or this dip will create problem in analysis. Please guide.
Depends on what the analysis is for, i would consider the plot to be sufficient. As for the dip could be cause of difference reasons:
Thanks ! What do you mean by NaN, I mean where it is returning NaN values?
Can I show this graph in my paper and say My accuracy is 94% which is my final result of classification, ignoring this dip.
I have never encountered such an error and i’m not the best person this  I would probably check with a supervisor about including this in a paper and the best supportive argument
Hi @arya47 did you ask the supervisor?