I have a model in matlab , which I am not able to regenerate in Python. My question is can I just plot the confusion matrix in python, using any lib like sklearn or so by just inputting the confusion matrix.
Plz help
You just need predicted values and expected values to have your confusion matrix, with sklearn.metrics.confusion_matrix for example.
from sklearn.metrics import confusion_matrix
import seaborn as sns
import matplotlib.pyplot as plt
def plot_conf(y_true, y_pred, label : str = "", figsize=(7,4)) :
cm = confusion_matrix(y_true, y_pred)
fig, ax = plt.subplots(figsize=figsize) # Sample figsize in inches
fig.suptitle("confusion matrix %s"%label)
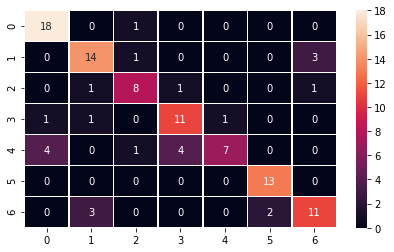
f = sns.heatmap(cm, annot=True, linewidths=.5, ax=ax)
So you can for example find a way to store, from matlab, the latter in a file that you will read afterwards in python for your computations : for example for a vector y, a text file containing on each line an element of y, so that the reconstruction in python will be easy.
Sorry, I don’t master matlab, this is just the idea that comes directly to my mind.
Sir I am not able to reproduce the predicted and true values here in python. Let me see, if i can do anything for that. But thanks for reply in my other code here in python I got this
Sir can I normalize it to find accuracy in percentage, like not in number.
Regards
You can just follow this link. You need to add this line
cmn = cm.astype('float') / cm.sum(axis=1)[:, np.newaxis]
Thanks mam @krishna511