Code running in a 3090 but stucking in Quadro P6000

Hi,
I’ve a model which runs on a 3090 but running exactly the same thing on a Quaddro P6000 makes it to get stuck.

literally the only difference is
CUDA_VISIBLE_DEVICES=0CUDA_VISIBLE_DEVICES=1

So both GPUs have ~24 Gb of mem. The only diff is the comp power.
If I reduce the batch size from n>1 to 1 it runs. How can I at least debug this? Coos using ctrl+c is not inmediate so I think it gets stuck in some c++ code.

Something interesting:
PROFILING FOR P6000
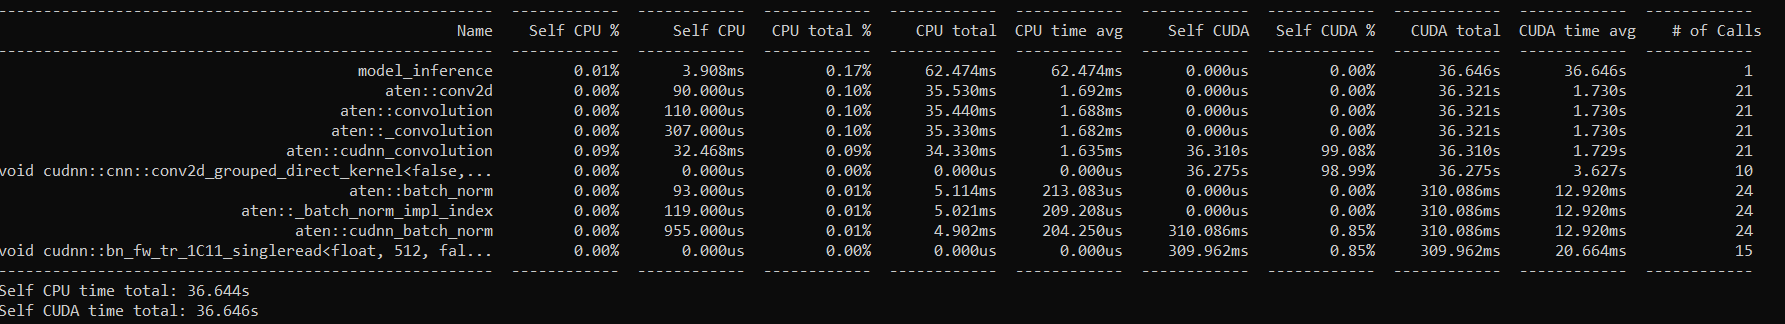
Profiling for batch size 2

-------------------------------------------------------  ------------  ------------  ------------  ------------  ------------  ------------  ------------  ------------  ------------  ------------  
                                        model_inference         0.03%      10.516ms         0.25%      93.005ms      93.005ms       0.000us         0.00%       36.814s       36.814s             1  
                                           aten::conv2d         0.00%     150.000us         0.12%      43.665ms       1.284ms       0.000us         0.00%       36.477s        1.073s            34  
                                      aten::convolution         0.00%     156.000us         0.12%      43.515ms       1.280ms       0.000us         0.00%       36.477s        1.073s            34  
                                     aten::_convolution         0.00%     484.000us         0.12%      43.359ms       1.275ms       0.000us         0.00%       36.477s        1.073s            34  
                                aten::cudnn_convolution         0.10%      35.670ms         0.11%      41.812ms       1.230ms       36.465s        99.05%       36.465s        1.072s            34  
void cudnn::cnn::conv2d_grouped_direct_kernel<false,...         0.00%       0.000us         0.00%       0.000us       0.000us       36.426s        98.95%       36.426s        3.643s            10  
                                       aten::batch_norm         0.00%     142.000us         0.02%       7.864ms     224.686us       0.000us         0.00%     321.496ms       9.186ms            35  
                           aten::_batch_norm_impl_index         0.00%     171.000us         0.02%       7.722ms     220.629us       0.000us         0.00%     321.496ms       9.186ms            35  
                                 aten::cudnn_batch_norm         0.00%       1.516ms         0.02%       7.551ms     215.743us     321.496ms         0.87%     321.496ms       9.186ms            35  
void cudnn::bn_fw_tr_1C11_singleread<float, 512, fal...         0.00%       0.000us         0.00%       0.000us       0.000us     320.452ms         0.87%     320.452ms      21.363ms            15  
-------------------------------------------------------  ------------  ------------  ------------  ------------  ------------  ------------  ------------  ------------  ------------  ------------  
Self CPU time total: 36.852s
Self CUDA time total: 36.814s

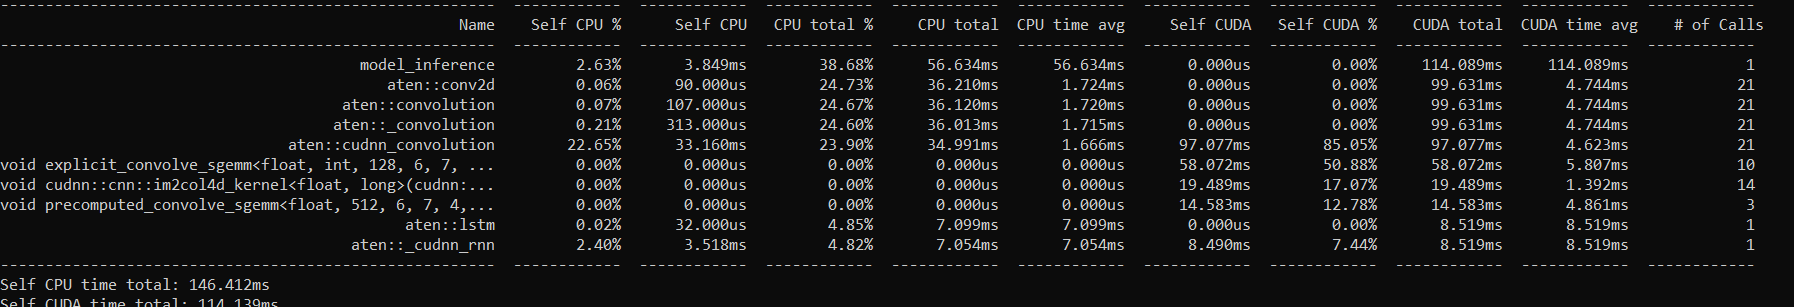
Profiling for batch size 1

-------------------------------------------------------  ------------  ------------  ------------  ------------  ------------  ------------  ------------  ------------  ------------  ------------  
                                                   Name    Self CPU %      Self CPU   CPU total %     CPU total  CPU time avg     Self CUDA   Self CUDA %    CUDA total  CUDA time avg    # of Calls  
-------------------------------------------------------  ------------  ------------  ------------  ------------  ------------  ------------  ------------  ------------  ------------  ------------  
                                        model_inference         6.47%      10.218ms        50.66%      80.003ms      80.003ms       0.000us         0.00%     115.739ms     115.739ms             1  
                                           aten::conv2d         0.10%     151.000us        26.08%      41.184ms       1.211ms       0.000us         0.00%     103.439ms       3.042ms            34  
                                      aten::convolution         0.11%     166.000us        25.98%      41.033ms       1.207ms       0.000us         0.00%     103.439ms       3.042ms            34  
                                     aten::_convolution         0.31%     484.000us        25.88%      40.867ms       1.202ms       0.000us         0.00%     103.439ms       3.042ms            34  
                                aten::cudnn_convolution        22.45%      35.461ms        24.84%      39.234ms       1.154ms     100.060ms        86.42%     100.060ms       2.943ms            34  
void explicit_convolve_sgemm<float, int, 128, 6, 7, ...         0.00%       0.000us         0.00%       0.000us       0.000us      60.359ms        52.13%      60.359ms       5.030ms            12  
void cudnn::cnn::im2col4d_kernel<float, long>(cudnn:...         0.00%       0.000us         0.00%       0.000us       0.000us      19.549ms        16.88%      19.549ms       1.629ms            12  
void precomputed_convolve_sgemm<float, 512, 6, 7, 4,...         0.00%       0.000us         0.00%       0.000us       0.000us      14.596ms        12.61%      14.596ms       4.865ms             3  
                                       aten::batch_norm         0.08%     132.000us         3.23%       5.099ms     145.686us       0.000us         0.00%       3.767ms     107.629us            35  
                           aten::_batch_norm_impl_index         0.11%     169.000us         3.15%       4.967ms     141.914us       0.000us         0.00%       3.767ms     107.629us            35  
-------------------------------------------------------  ------------  ------------  ------------  ------------  ------------  ------------  ------------  ------------  ------------  ------------  
Self CPU time total: 157.931ms
Self CUDA time total: 115.790ms

PROFILING FOR 3090
bATCH Size 1

-------------------------------------------------------  ------------  ------------  ------------  ------------  ------------  ------------  ------------  ------------  ------------  ------------  
                                                   Name    Self CPU %      Self CPU   CPU total %     CPU total  CPU time avg     Self CUDA   Self CUDA %    CUDA total  CUDA time avg    # of Calls  
-------------------------------------------------------  ------------  ------------  ------------  ------------  ------------  ------------  ------------  ------------  ------------  ------------  
                                        model_inference        10.21%      10.064ms        99.94%      98.509ms      98.509ms       0.000us         0.00%      25.219ms      25.219ms             1  
                                           aten::conv2d         0.15%     143.000us        58.44%      57.606ms       1.694ms       0.000us         0.00%      19.810ms     582.647us            34  
                                      aten::convolution         0.17%     165.000us        58.30%      57.463ms       1.690ms       0.000us         0.00%      19.810ms     582.647us            34  
                                     aten::_convolution         0.50%     497.000us        58.13%      57.298ms       1.685ms       0.000us         0.00%      19.810ms     582.647us            34  
                                aten::cudnn_convolution        51.28%      50.549ms        56.51%      55.706ms       1.638ms      18.603ms        73.68%      18.603ms     547.147us            34  
sm80_xmma_fprop_implicit_gemm_tf32f32_tf32f32_f32_nh...         0.00%       0.000us         0.00%       0.000us       0.000us      16.042ms        63.54%      16.042ms       1.146ms            14  
                                       aten::batch_norm         0.12%     121.000us         4.63%       4.568ms     130.514us       0.000us         0.00%       1.524ms      43.543us            35  
                           aten::_batch_norm_impl_index         0.18%     175.000us         4.51%       4.447ms     127.057us       0.000us         0.00%       1.524ms      43.543us            35  
                                 aten::cudnn_batch_norm         1.40%       1.380ms         4.33%       4.272ms     122.057us       1.524ms         6.04%       1.524ms      43.543us            35  
void at::native::unrolled_elementwise_kernel<at::nat...         0.00%       0.000us         0.00%       0.000us       0.000us       1.388ms         5.50%       1.388ms      19.829us            70  
-------------------------------------------------------  ------------  ------------  ------------  ------------  ------------  ------------  ------------  ------------  ------------  ------------  
Self CPU time total: 98.571ms
Self CUDA time total: 25.248ms
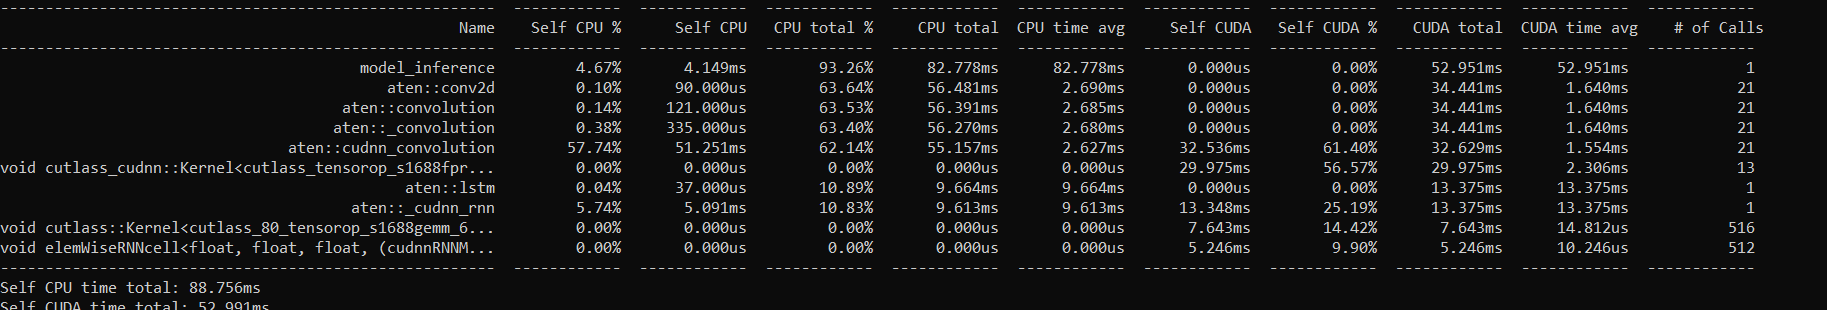
Batch size 2

-------------------------------------------------------  ------------  ------------  ------------  ------------  ------------  ------------  ------------  ------------  ------------  ------------  
                                                   Name    Self CPU %      Self CPU   CPU total %     CPU total  CPU time avg     Self CUDA   Self CUDA %    CUDA total  CUDA time avg    # of Calls  
-------------------------------------------------------  ------------  ------------  ------------  ------------  ------------  ------------  ------------  ------------  ------------  ------------  
                                        model_inference        11.12%      11.091ms        94.65%      94.416ms      94.416ms       0.000us         0.00%      45.827ms      45.827ms             1  
                                           aten::conv2d         0.14%     143.000us        46.18%      46.068ms       1.355ms       0.000us         0.00%      36.621ms       1.077ms            34  
                                      aten::convolution         0.18%     177.000us        46.04%      45.925ms       1.351ms       0.000us         0.00%      36.621ms       1.077ms            34  
                                     aten::_convolution         0.51%     508.000us        45.86%      45.748ms       1.346ms       0.000us         0.00%      36.621ms       1.077ms            34  
                                aten::cudnn_convolution        37.33%      37.240ms        44.24%      44.137ms       1.298ms      34.173ms        74.50%      34.269ms       1.008ms            34  
void cutlass_cudnn::Kernel<cutlass_tensorop_s1688fpr...         0.00%       0.000us         0.00%       0.000us       0.000us      29.941ms        65.28%      29.941ms       2.303ms            13  
                                       aten::batch_norm         0.14%     136.000us         5.61%       5.599ms     159.971us       0.000us         0.00%       3.141ms      89.743us            35  
                           aten::_batch_norm_impl_index         0.17%     170.000us         5.48%       5.463ms     156.086us       0.000us         0.00%       3.141ms      89.743us            35  
                                 aten::cudnn_batch_norm         1.52%       1.513ms         5.31%       5.293ms     151.229us       3.141ms         6.85%       3.141ms      89.743us            35  
void cudnn::batchnorm_fwtr_nhwc_semiPersist<float, f...         0.00%       0.000us         0.00%       0.000us       0.000us       2.635ms         5.74%       2.635ms     175.667us            15  
-------------------------------------------------------  ------------  ------------  ------------  ------------  ------------  ------------  ------------  ------------  ------------  ------------  
Self CPU time total: 99.756ms
Self CUDA time total: 45.867ms

Could you post a minimal executable code snippet which would show the hang on the P6000 as well as the output of python -m torch.utils.collect_env so that we could debug it, please?

Soo could I send a link to ready-to-use repo by DM? I cannot disclousure it in a public forum :grimacing:

I wouldn’t recommend to send private code snippets to anyone and would also consider myself a “public user”, as we don’t have an NDA etc.
Could you try to come up with a proxy model / code, which could be shared in public and would show the same issue?

It’s academy research, not important enough to ask for a NDA but important enough not to post it in a forum :slight_smile:
Anyway yep. Got something similiar for a public model:
Batch size 1


Batch size 2

Still same for 3090 it works bs=2

Anyway I think there are some problems with the complex modules. I saw that results for some libraries vary across pytorch versions and cpu results does not match gpu’s. Even across gpus itself on some cases.

Clone https://github.com/JuanFMontesinos/pytorch_p6000
and run debug.py

Let me know if you discover anything and ofc thanks!

Bit off topic but also found this in case devs find it interesting.:

Thanks for the repository.
I’ve installed a new Ubuntu 20.04 OS with the latest CUDA driver on a P6000 node and am unfortunately unable to run the code.
First issue:

Traceback (most recent call last):
  File "debug.py", line 58, in <module>
    model(inputs)
  File "/opt/conda/lib/python3.8/site-packages/torch/nn/modules/module.py", line 1102, in _call_impl
    return forward_call(*input, **kwargs)
  File "/tmp/pytorch_p6000/VnBSS/models/llcp_net.py", line 191, in forward
    x = sp_mix.permute(0, 3, 1, 2)
RuntimeError: number of dims don't match in permute

I’ve unsqueezed an additional dimension for sp_mix and spm to avoid this issue, which was followed by:

  File "/opt/conda/lib/python3.8/site-packages/torch/nn/modules/conv.py", line 446, in forward
    return self._conv_forward(input, self.weight, self.bias)
  File "/opt/conda/lib/python3.8/site-packages/torch/nn/modules/conv.py", line 442, in _conv_forward
    return F.conv2d(input, weight, bias, self.stride,
RuntimeError: Given groups=1, weight of size [96, 2, 1, 7], expected input[2, 1, 256, 256] to have 2 channels, but got 1 channels instead

so clearly a simple unsqueeze isn’t working. I’ve thus used sp_mix = sp_mix.unsqueeze(3).repeat(1, 1, 1, 2) for both tensors to make sure that 2 channels are used.
Afterwards, the code fails with:

  File "/opt/conda/lib/python3.8/site-packages/torch/nn/modules/module.py", line 1102, in _call_impl
    return forward_call(*input, **kwargs)
  File "/opt/conda/lib/python3.8/site-packages/torch/nn/modules/conv.py", line 446, in forward
    return self._conv_forward(input, self.weight, self.bias)
  File "/opt/conda/lib/python3.8/site-packages/torch/nn/modules/conv.py", line 442, in _conv_forward
    return F.conv2d(input, weight, bias, self.stride,
RuntimeError: Input type (CUDAComplexFloatType) and weight type (torch.cuda.FloatTensor) should be the same

so I’m unsure how it’s executable on your other devices.

Ohmm sorry, it’s all about the behaviour of Spectrogram which I think used to return real and imag part by default and now returns complex. I modified in the server but not in local.
Should be a matter of passing return_complex=False when instantiating Spectrogram in the line 103 of llcp_net.py.
Commited anyway. And apologies.

Depending on the pytorch version used return_complex arg as well as profiler are not available. It’s a matter of removing those.
I asked a college to run it in another gpu and found the same issue for:

GPU 1: NVIDIA GeForce GTX 1080 Ti
GPU 2: NVIDIA TITAN Xp
PyTorch version: 1.7.0+cu110
Is debug build: True
CUDA used to build PyTorch: 11.0
ROCM used to build PyTorch: N/A
OS: Ubuntu 18.04.3 LTS (x86_64)
GCC version: (Ubuntu 7.5.0-3ubuntu1~18.04) 7.5.0
Clang version: Could not collect
CMake version: version 3.18.0
Python version: 3.6 (64-bit runtime)
Is CUDA available: True
CUDA runtime version: Could not collect
GPU models and configuration:
GPU 0: NVIDIA GeForce RTX 3090
GPU 1: NVIDIA GeForce GTX 1080 Ti
GPU 2: NVIDIA TITAN Xp
Nvidia driver version: 470.82.00
cuDNN version: Could not collect
HIP runtime version: N/A
MIOpen runtime version: N/A
Versions of relevant libraries:
[pip3] facenet-pytorch==2.5.1
[pip3] numpy==1.19.4
[pip3] torch==1.7.0+cu110
[pip3] torch-mir-eval==0.3.post2
[pip3] torchaudio==0.7.0
[pip3] torchsummary==1.5.1
[pip3] torchvision==0.8.1+cu110
[conda] Could not collect

Any news or hint about how to debug it?

No news yet, as I need to try to lease and setup a new P6000 node and try to rerun your updated code.

Oh I see. Thanks! Anyway should be reproducible in other gpus it seems.
Let me know when you have any news.

Juan

Seems that this happens due to this line of code over a complex spectrogram:

sp_mix = sp_mix_raw[:, ::2, ...]  # BxFxTx2

which can be “solved” by doing the slicing in cpu

sp_mix = sp_mix_raw.cpu()[:, ::2, ...].cuda()  # BxFxTx2

It seems it collapse as memory is not contiguous soo another way of solving it is

sp_mix = sp_mix_raw.contiguous()[:, ::2, ...]  # BxFxTx2