I’m trying to solve a time-series regression problem using neural networks by adapting curiosily’s tutorial. After the training/testing stage, I want to plot the predicted results alongside the expected values. Can you please help?
This is basically the same question I posted on stackoverflow: python - Plot predicted and actual results of Pytorch regression problem - Stack Overflow (the link also contains a short snippet of my data)
import os
import numpy as np
import matplotlib.pyplot as plt
import pandas as pd
import pandas.io.sql as sql
from datetime import date, datetime, time, timedelta
import holidays

from db import DB

import torch
from torch import nn, optim

from sklearn.model_selection import train_test_split
from sklearn.preprocessing import MinMaxScaler, StandardScaler

## load data
#mydata = pd.read_csv(path+'mydata.csv')
#mydata.head()

scaler = MinMaxScaler()

## inputs
cols0 = [i for i in ['x1','x2','x3','x4','x5','x6','year','week'] if i != 'y']
X = mydata[cols0]

## output
y0 = mydata[['y']]

X_train, X_test, y_train, y_test = train_test_split(X, y0, test_size=0.3, random_state=50)


## convert everything to tensors
X_train = torch.from_numpy(X_train.values).float()
y_train = torch.squeeze(torch.from_numpy(y_train.values).float())
X_test = torch.from_numpy(X_test.values).float()
y_test = torch.squeeze(torch.from_numpy(y_test.values).float())


## build neural network
class Net(nn.Module):
    def __init__(self, n_features):
        super(Net, self).__init__()
        # n_features = no. inputs
        n1 = 8 # no. nodes in layer 1
        n2 = 5 # no. nodes in layer 2
        n3 = 4 # no. nodes in layer 3
        n4 = 5 # no. nodes in layer 4
        n5 = 2 # no. nodes in layer 5
        self.fc1 = nn.Linear(n_features,n1)
        self.fc2 = nn.Linear(n1,n2)
        self.fc3 = nn.Linear(n2,n3)
        self.fc4 = nn.Linear(n3,n4)
        self.fc5 = nn.Linear(n4,n5)
        self.fc6 = nn.Linear(n5,1)
    def forward(self, x):
        #x = F.relu(self.fc1(x))
        x = torch.tanh(self.fc1(x)) # activation function in layer 1
        x = torch.sigmoid(self.fc2(x))
        x = torch.sigmoid(self.fc3(x))
        x = torch.tanh(self.fc4(x))
        x = torch.tanh(self.fc5(x))
        return torch.sigmoid(self.fc6(x)) # activation function in layer 3 (output)


net = Net(X_train.shape[1])
criterion = nn.MSELoss() # loss function
optimizer = optim.Adam(net.parameters(), lr=0.0001)


## training

for epoch in range(2001):

    y_pred = net(X_train)
    y_pred = torch.squeeze(y_pred)
    train_loss = criterion(y_pred, y_train)

    # forward feed
    y_test_pred = net(X_test)
    y_test_pred = torch.squeeze(y_test_pred)

    # calculate the loss
    test_loss = criterion(y_test_pred, y_test)

    # clear out gradients from the last step loss.backward()
    optimizer.zero_grad()

    # back propagation
    train_loss.backward()

    # update weights
    optimizer.step()


## reverse scaling of test data and model predictions

scaler0 = scaler.fit(np.expand_dims(y_train, axis=1))
ytrue = scaler0.inverse_transform(np.expand_dims(y_test.detach().numpy().flatten(),axis=0)).flatten()
ypred = scaler0.inverse_transform(np.expand_dims(y_test_pred.detach().numpy(),axis=0)).flatten()


plt.figure()
plt.plot(ypred, label='predicted')
plt.plot(ytrue, label='actual')
plt.ylabel('output y')
plt.legend()
plt.show()
Your code snippet and the cross post already show how to plot the predictions and ground truth data, so I’m unsure where you are stuck at the moment.
In case you would like to improve the model performance (since it’s giving a straight line), you could scale down the problem and make sure the model is able to overfit a small dataset (e.g. just 10 samples) by playing around with the hyperparameters as well as the model architecture (e.g. replace sigmoid and tanh with relu; you might also want to remove the last activation function).
Ok thanks.
In that case, yes I want to improve the model performance. I’ve tried doing as you suggested and changed the model hyperparameters, using only the first 10 rows of my dataset, etc. The graph of the predicted value is always a horizontal line.
I also noticed that the “true” and predicted values are always between 0 and 1. Has the scaling actually been reversed?
But since I’ll eventually be working with a bigger dataset (potentially thousands of rows), I’ll have to improve the model performance by tuning the hyperparameters. If I use RayTune and/or Ax, what would be the best and simplest way to modify the code?
I’m not familiar with either of the mentioned libraries, but would still recommend to make sure the model can overfit the small dataset. E.g. did you try to replace the activation functions with a relu?
What libraries do you recommend for hyperparameter optimization?
I’m still trying to overfit a small dataset by using your suggestions, but the predicted values are always a horizontal line.
I can’t recommend any specific library for hyperparameter optimization, as I’m usually not using them, so let’s wait for others to chime in.
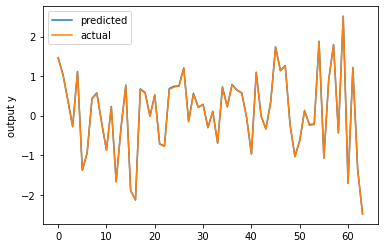
Using your model and removing the last activation I’m able to overfit a random input and target tensor:
class Net(nn.Module):
    def __init__(self, n_features):
        super(Net, self).__init__()
        # n_features = no. inputs
        n1 = 8 # no. nodes in layer 1
        n2 = 5 # no. nodes in layer 2
        n3 = 4 # no. nodes in layer 3
        n4 = 5 # no. nodes in layer 4
        n5 = 2 # no. nodes in layer 5
        self.fc1 = nn.Linear(n_features,n1)
        self.fc2 = nn.Linear(n1,n2)
        self.fc3 = nn.Linear(n2,n3)
        self.fc4 = nn.Linear(n3,n4)
        self.fc5 = nn.Linear(n4,n5)
        self.fc6 = nn.Linear(n5,1)
    def forward(self, x):
        x = torch.tanh(self.fc1(x))
        x = torch.sigmoid(self.fc2(x))
        x = torch.sigmoid(self.fc3(x))
        x = torch.tanh(self.fc4(x))
        x = torch.tanh(self.fc5(x))
        return self.fc6(x)

torch.manual_seed(2809)
X_train = torch.randn(64, 10)
y_train = torch.randn(64, 1)
net = Net(X_train.shape[1])
criterion = nn.MSELoss() # loss function
optimizer = torch.optim.Adam(net.parameters(), lr=1e-3)

## training
for epoch in range(15000):
    y_pred = net(X_train)
    train_loss = criterion(y_pred, y_train)
    optimizer.zero_grad()
    train_loss.backward()
    optimizer.step()
    print('epoch {}, loss {}'.format(epoch, train_loss.item()))

plt.figure()
plt.plot(y_pred.detach().numpy(), label='predicted')
plt.plot(y_train.numpy(), label='actual')
plt.ylabel('output y')
plt.legend()
plt.show()
You should also check, why you are using squeeze() on the model output, as I could imagine it might create unwanted broadcasting in the loss calculation (the criterion should raise a warning).
Thanks for that. I use squeeze() on the model output because it was also used in the tutorial code so I just kept it for my regression. What additional problems would I encounter if I kept it in my code?
I’m also concerned that the reverse scaling isn’t doing its job - I expect the reverse-scaled values to be much bigger.
## reverse scaling of test data and model predictions
scaler0 = scaler.fit(np.expand_dims(y_train, axis=1))
ytrue = scaler0.inverse_transform(np.expand_dims(y_test.detach().numpy().flatten(),axis=0)).flatten()
ypred = scaler0.inverse_transform(np.expand_dims(y_test_pred.detach().numpy(),axis=0)).flatten()
A hyperparameter optimization library sounds useful because I don’t want to manually find the best learning rate, no. hidden layers, etc.