Confusion about torch.autograd.profiler.profile API

Based on my understanding, PyTorch provides two APIs for profiling our application.

  1. One is the torch.autograd.profiler.profile API. It has use_cuda flag, and we can choose to set it for either CPU or CUDA mode.

  2. Another API for profiling is torch.utils.bottleneck (which provides both CPU and CUDA mode profiling according to the documentation https://pytorch.org/docs/stable/bottleneck.html).

And I expect them to give same or at least very close profiling results, but they actually didn’t. Below are my snippet for profiling and results I got.

def main():
    parser = argparse.ArgumentParser()
    parser.add_argument('-o', '--option', default=1, type=int)
    args = parser.parse_args()

    data = torch.randn(1, 3, 224, 224).cuda()
    net = resnet18().cuda()
    net.eval()

    # Warm up run
    for _ in range(10):
        net(data)

    if args.option == 0:
        for _ in range(100):
            out = net(data)

    elif args.option == 1:
        # Profiling 1
        start = torch.cuda.Event(enable_timing=True)
        end = torch.cuda.Event(enable_timing=True)

        timing = 0
        for _ in range(100):
            start.record()
            out = net(data)
            end.record()
            torch.cuda.synchronize()
            timing += start.elapsed_time(end)
        print(timing)

    elif args.option == 2:
        # Profiling 2
        with torch.autograd.profiler.profile(use_cuda=True) as prof:
            for _ in range(100):
                net(data)
        print(prof.key_averages().table(sort_by='cuda_time_total'))
    elif args.option == 3:
        # Profiling 3
        with torch.autograd.profiler.profile() as prof:
            for _ in range(100):
                net(data)
        print(prof.key_averages().table(sort_by='cpu_time_total'))

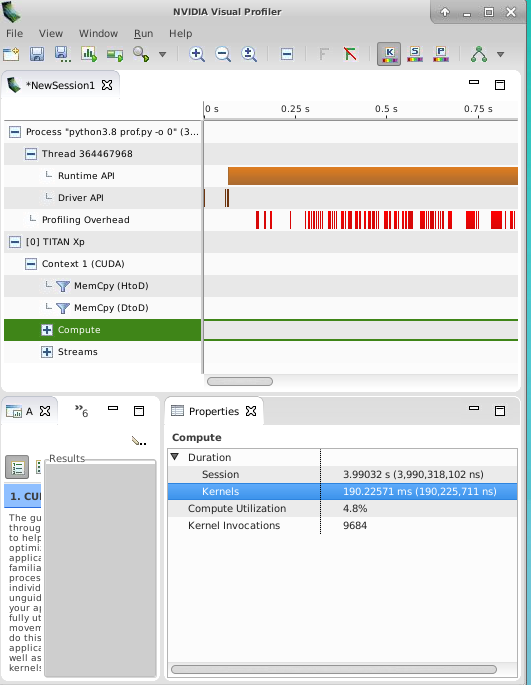
torch.util.bottleneck API

python -m torch.utils.bottleneck prof.py -o 0

CPU mode ... 
Self CPU time total: 218.316ms
CUDA time total: 0.000us

CUDA mode ...
Self CPU time total: 207.595ms
CUDA time total: 207.673ms

torch.autograd.profiler.profile API

python prof.py -o 3

CPU mode ...
Self CPU time total: 295.712ms

python prof.py -o 2
CUDA mode ...
Self CPU time total: 499.643ms !!!!!!
CUDA time total: 1.802s !!!!!!

My question is why there is such a big profiling time discrepancy when I use torch.autograd.profiler.profile(use_cuda=True)?

Could you add synchronizations after the first CUDA call?
I’m not sure, if the autograd.profiler will accumulate the time needed for the CUDA context creation (and all other calls which were executed before and are not finished).

Hey @ptrblck, thanks for your suggestion. Unfortunately that does not change much.

I also attempted to use nvvp to profile the execution on the Nvidia side, and the kernel takes roughly 190ms for compute as shown in the below graph.

That makes me really confused about how to interpret each API’s result.

This would approx. fit the first output, and could mean that the second approach is accumulating the time of all operations.

---------------------------  ---------------  ---------------  ---------------  ---------------  ---------------  ---------------  ---------------  ---------------  ---------------
Name                         Self CPU total %  Self CPU total   CPU total %      CPU total        CPU time avg     CUDA total %     CUDA total       CUDA time avg    Number of Calls
---------------------------  ---------------  ---------------  ---------------  ---------------  ---------------  ---------------  ---------------  ---------------  ---------------
conv2d                       3.07%            13.165ms         42.23%           181.103ms        90.551us         19.28%           278.898ms        139.449us        2000
convolution                  3.44%            14.748ms         39.16%           167.937ms        83.969us         18.64%           269.652ms        134.826us        2000
_convolution                 6.31%            27.039ms         35.72%           153.189ms        76.595us         17.82%           257.776ms        128.888us        2000
cudnn_convolution            27.42%           117.591ms        27.42%           117.591ms        58.796us         15.84%           229.185ms        114.593us        2000
batch_norm                   3.47%            14.885ms         38.57%           165.399ms        82.700us         8.48%            122.629ms        61.315us         2000
_batch_norm_impl_index       11.03%           47.299ms         35.10%           150.514ms        75.257us         7.81%            112.969ms        56.485us         2000
cudnn_batch_norm             18.00%           77.173ms         18.00%           77.173ms         38.586us         3.93%            56.870ms         28.435us         2000
relu_                        8.11%            34.773ms         8.11%            34.773ms         20.455us         2.08%            30.042ms         17.672us         1700
contiguous                   8.14%            34.914ms         8.14%            34.914ms         2.885us          1.97%            28.449ms         2.351us          12100
add_                         3.78%            16.191ms         3.78%            16.191ms         20.239us         1.02%            14.801ms         18.501us         800
to                           2.89%            12.375ms         3.12%            13.363ms         133.634us        0.91%            13.126ms         131.262us        100
adaptive_avg_pool2d          0.46%            1.954ms          1.63%            6.982ms          69.815us         0.48%            6.873ms          68.725us         100
max_pool2d                   0.20%            859.574us        0.85%            3.662ms          36.618us         0.35%            5.001ms          50.011us         100
addmm                        0.99%            4.265ms          0.99%            4.265ms          42.647us         0.32%            4.568ms          45.685us         100
max_pool2d_with_indices      0.65%            2.802ms          0.65%            2.802ms          28.022us         0.31%            4.461ms          44.609us         100
view                         0.67%            2.873ms          0.67%            2.873ms          9.578us          0.20%            2.943ms          9.809us          300
mean                         0.63%            2.697ms          0.63%            2.697ms          26.970us         0.20%            2.822ms          28.224us         100
flatten                      0.16%            684.070us        0.51%            2.188ms          21.880us         0.15%            2.153ms          21.531us         100
reshape                      0.15%            649.266us        0.35%            1.504ms          15.039us         0.10%            1.491ms          14.906us         100
empty                        0.23%            988.832us        0.23%            988.832us        9.888us          0.07%            985.961us        9.860us          100
unsigned short               0.21%            909.201us        0.21%            909.201us        9.092us          0.06%            872.228us        8.722us          100
---------------------------  ---------------  ---------------  ---------------  ---------------  ---------------  ---------------  ---------------  ---------------  ---------------
Self CPU time total: 428.835ms
CUDA time total: 1.447s

The CUDA time total is just sum of everything from table above. And I assume the operations in the table CUDA category are for compute. If it is for API call, then the time should fall under CPU time category right?

1 Like

I also met a similar problem: The profiling result is quite different from what I record manually and I dont know the exact meaning of “Self CPU time total/ CUDA time total”.

1 Like

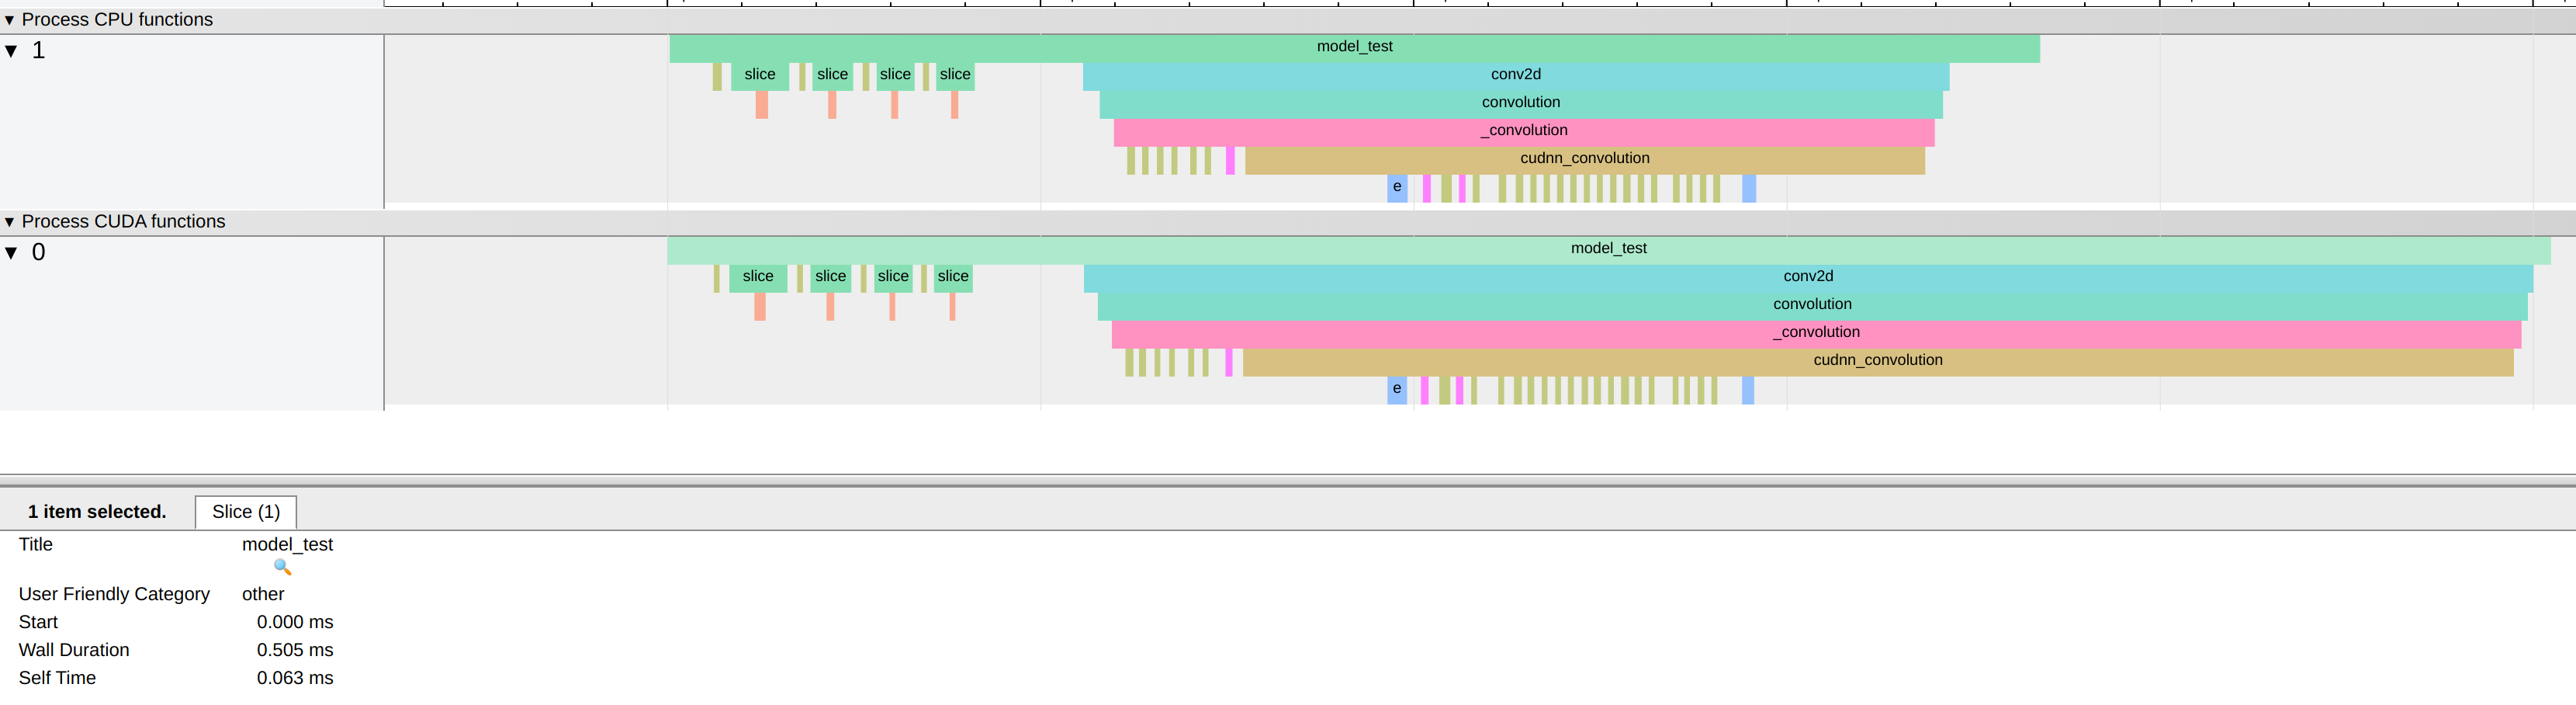
Yes, met the same problem. The difference is actually big from what the profiler printed and what I recorded using the following code:

with torch.autograd.profiler.profile(use_cuda=True) as prof:
with torch.autograd.profiler.record_function(“model_test”):
out_test = model_test(img)
print('test time is ', prof)
prof.export_chrome_trace(“/trace.json”.format(count))

I tested with model with only one conv layer, and did 1 batch warm up before this…
The printed prof gives me results:

Self CPU time total: 367.306us
CUDA time total: 2.113ms

whereas the record tracking log gives me:
cpu time is the same, but cuda time is so different. tracing log gives me:

cuda: wall duration 0.505 ms, self time 0.063 ms


@ptrblck do you by chance know why? Thanks! :slight_smile:

Not directly, but did you properly synchronize your code in your manual profiling?

Hi, I did put cuda synchronize before, is that enough?
but unfortunately, the difference between the tracing log and the printed report still big (only cuda total). It seems for me that in the printed report, the cuda total time just sum up all the items in the table without considering some of the processes are of subprocess of other processes(for example, the first item in the table is the whole inference time consumption). so it over-calculated the time. Does that make sense to you? thanks!

torch.cuda.synchronize(), 
with torch.autograd.profiler.profile(use_cuda=True) as prof:
        out_test = model_test(img)
print('test time is ', prof)