Yes, met the same problem. The difference is actually big from what the profiler printed and what I recorded using the following code:
with torch.autograd.profiler.profile(use_cuda=True) as prof:
with torch.autograd.profiler.record_function(“model_test”):
out_test = model_test(img)
print('test time is ', prof)
prof.export_chrome_trace(“/trace.json”.format(count))
I tested with model with only one conv layer, and did 1 batch warm up before this…
The printed prof gives me results:
Self CPU time total: 367.306us
CUDA time total: 2.113ms
whereas the record tracking log gives me:
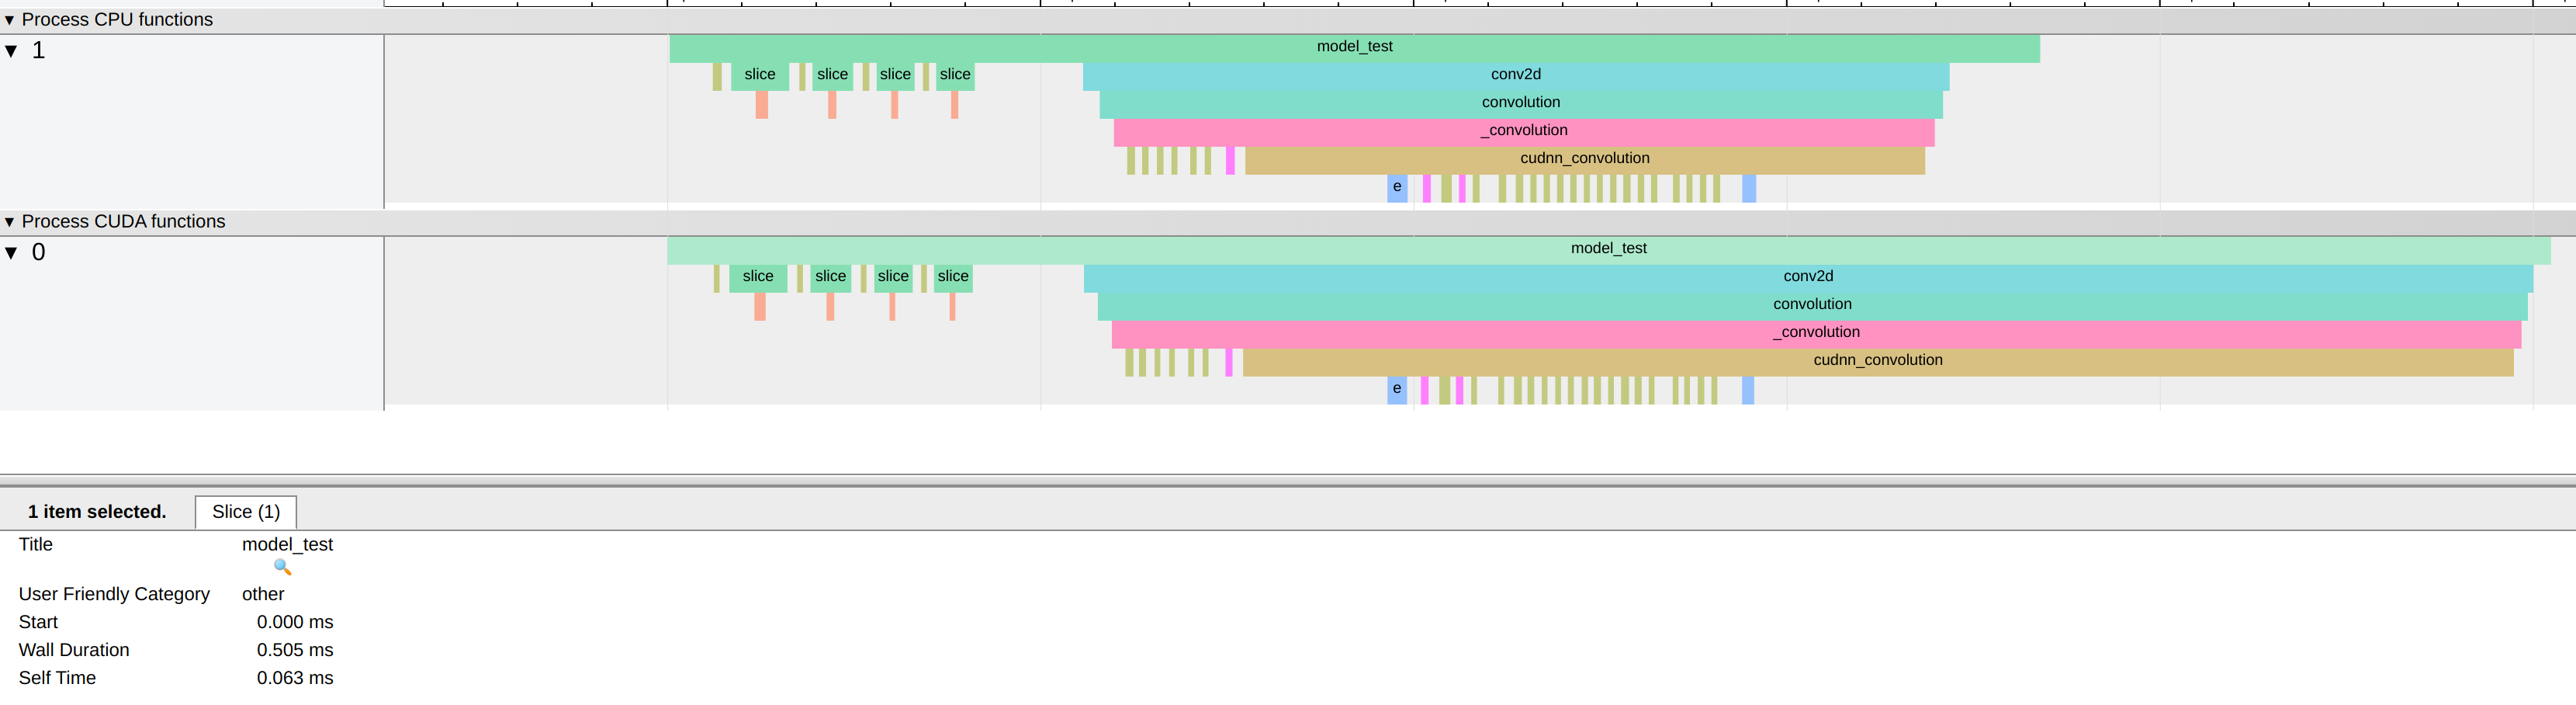
cpu time is the same, but cuda time is so different. tracing log gives me:
cuda: wall duration 0.505 ms, self time 0.063 ms
@ptrblck do you by chance know why? Thanks!