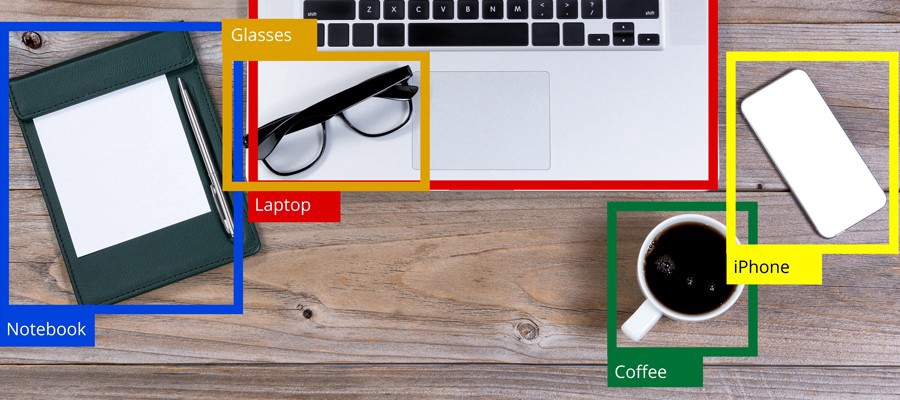
I have done object detection on my custom dataset and I got output as shown in an image and I saved the results in txt files. The txt file has label, bbox coordinator and the score. How to represent each bounding box as a node??
Which information do you want to have stored in each node?
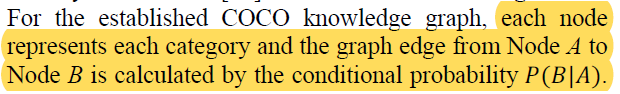
Once you have the nodes, which is the relationship between them? To construct a graph we have to draw edges. but these connections should have some meaning.