Here are my results after performing 1d convolution. I have the following CNN architecture for a dataset sized [batch, 1, 402].
class Simple1DCNN(torch.nn.Module):
def __init__(self):
super(Simple1DCNN, self).__init__()
self.layer1 = torch.nn.Conv1d(in_channels = 1, out_channels = 10, kernel_size = 3)
self.act = torch.nn.ReLU()
self.layer2 = torch.nn.Conv1d(in_channels = 10, out_channels = 20, kernel_size = 3)
self.fc1 = torch.nn.Linear(20*398, 1000)
self.fc2 = torch.nn.Linear(1000, 50)
self.fc3 = torch.nn.Linear(50, 1)
self.conv2_drop = torch.nn.Dropout(0.5)
def forward(self, x):
x = self.act(self.layer1(x))
x = self.act(self.conv2_drop(self.layer2(x)))
x = x.view(-1, x.shape[1] * x.shape[-1])
x = torch.tanh(self.fc1(x))
x = torch.tanh(self.fc2(x))
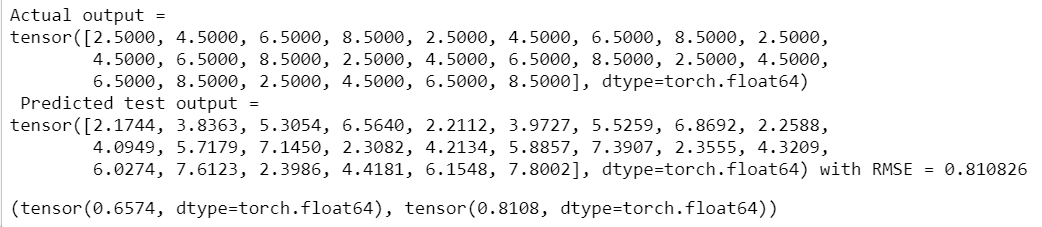
x = self.fc3(x) # collecting the output of linear layer
return x
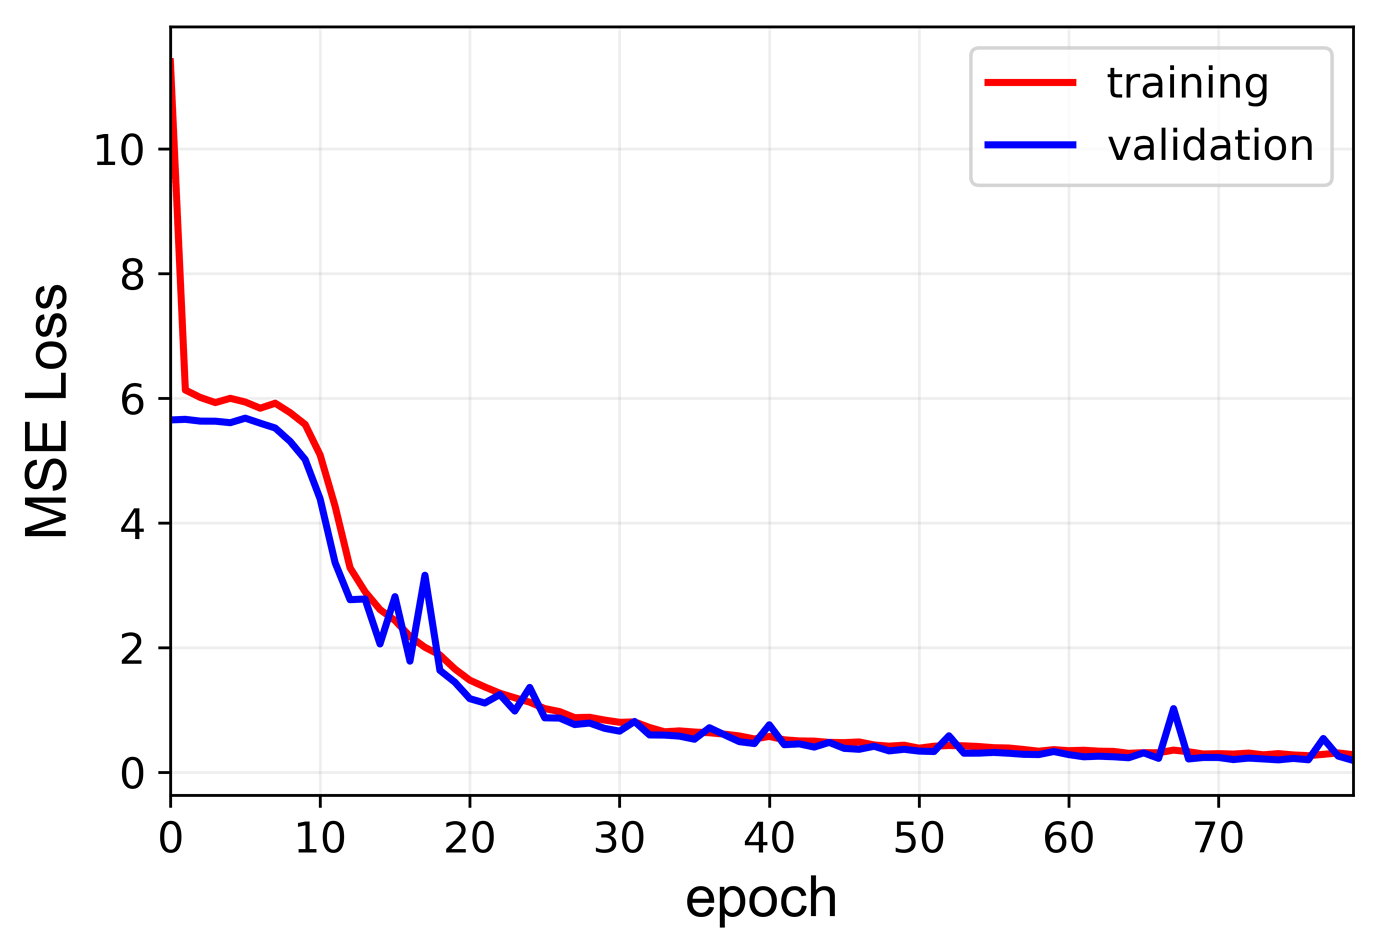
I have used MSE loss as a loss metric. Does the plots look okay? Since the ouputs are float value (not labels) are the bumps on the validation loss justifiable?
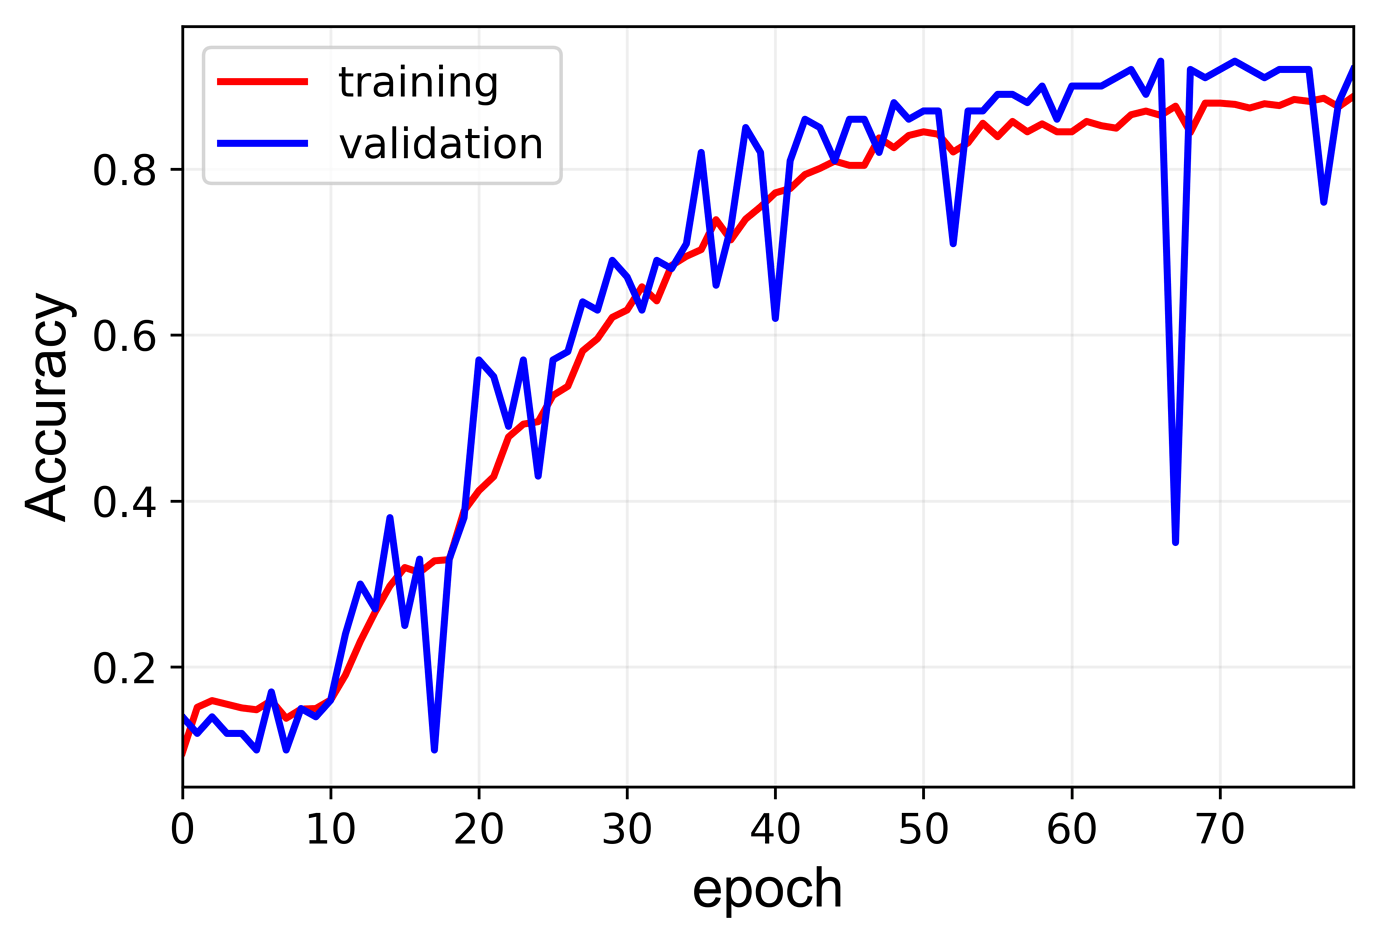
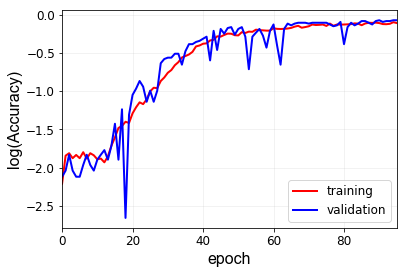
P.S. the accuracy is just for my sake. I have considered the output within 10% of the actual output value to be accurate. How do you think I can minimize the fluctuations of validation accuracy?
How large is your validation set and is the accuracy drop reproducible in this particular epoch?
To further improve your model, you could try to plot the log(loss) and see, if the training loss is decreasing, as it’s a bit hard to tell from the current plot.
If that’s not the case, you could add more aggressive data augmentation and increase the model capacity (more or bigger layers). Once your model starts to overfit, add regularization.
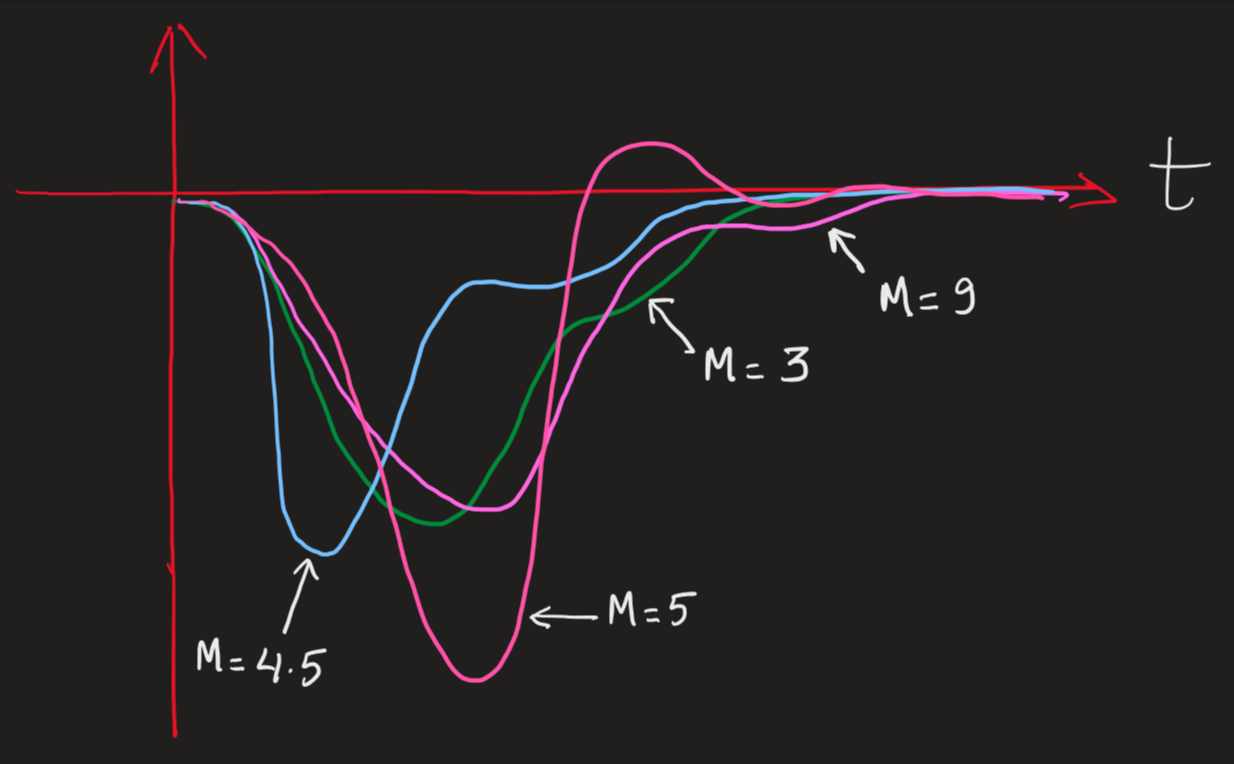
The length of my dataset is 1700 and I use 80% (1360) for training and 20% (340) for validation. To clarify you, my dataset looks something like the sketch below:
Each snapshot (i.e. each of the waveform from 0 - t) represents a value M. The way I am training is, feeding each of the data points of the waveform as input (for e.g. for green signal, the input will be t points from its waveform and the network will have to provide M = 3 as an output). P.S. some of the wave forms can be very close for values such as M = 9 and M = 9.5. How do you think I can use data augmentation techniques here? I would highly appreciate your suggestion on this.
Meanwhile, I lost the seed since I am using jupyter notebook. Hence, I was not able to reproduce the exact same results. Sorry about that. I again ran the simulation for different seed value.
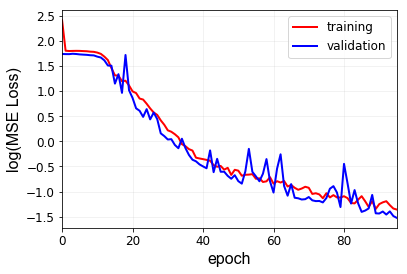
Here are the log(losses) and accuracy. What do you think about these plots? Is log(loss) the right thing to look even if I am using torch.nn.MSE() as my loss metric? I am not sure if I plotted the loss loss correctly. I just used np.log(losses) where I got losses from MSE.
That’s a tricky question, as I’m not familiar with the data.
You would have to narrow down certain properties if a specific class, e.g. M=9, and compare how the waveforms differ for this particular class.
Are they shifted or scaled slightly? Do they have more “noise” in the signal?
Note that you would have to avoid such aggressive augmentation techniques that your data sample might be pushed to another class.
Also, knowledge about the underlying physical process might be useful.
I.e. how was the data created and what kind of “noise” might the recording setup experience?
Yes, the log should be fine for visualization purposes and helps a bit in seeming the decreasing behavior for small (close to 0) values.
The loss curves look generally good and it seems your model is still learning.
Do you see some overfitting after a while or a static loss?
The data was created using a linearized model of a system. Generally for higher values of M i.e. M = 8,9 or 10 (could also be continuous values like 8.8, 10.2, 9.7) the curve gets really close. Since the signals are measured, they already contain some noise (assumed to be gaussian).
For now with 150 epochs of training, I am getting an accuracy of about 96% which seems good I guess. The model does not overfit with higher epochs. i believe, the problem is solved for now. Thank you for your suggestions and tips (specially the observation of log (loss) for small values of losses) . This will come in very handy for my future works.