CPU is used despite all my tensors are moved to GPU

I have a CUDA supported GPU (Nvidia GeForce GTX 1070) and I have installed both of the CUDA (version 10) and the CUDA-supported version of PyTorch.

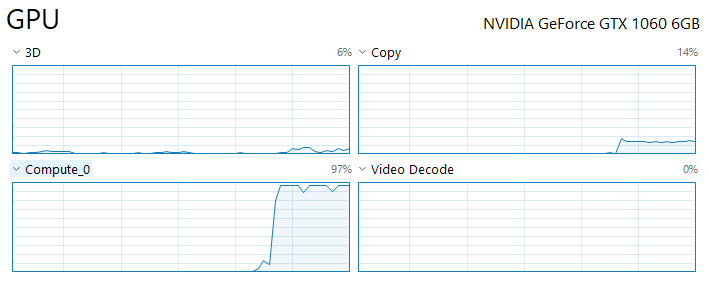
Despite my GPU is detected, and I have moved all the tensors to GPU, my CPU is used instead of GPU as I see almost no GPU usage when I monitor it.

Here is the code:

num_epochs = 10
batch_size = 20
learning_rate = 0.0001
log_interval = 50

class AndroModel(torch.nn.Module):

    def __init__(self, input_size):
        super(AndroModel, self).__init__()

        self.kernel_size = 3
        self.padding = 0
        self.stride = 1
        self.input_size = input_size

        self.conv1 = nn.Sequential(
            nn.Conv1d(in_channels=1, out_channels=16, kernel_size=self.kernel_size, padding=self.padding,
                      stride=self.stride, bias=False),
            nn.ReLU(inplace=True)
        )
        self.conv2 = nn.Sequential(
            nn.Conv1d(in_channels=16, out_channels=32, kernel_size=self.kernel_size, padding=self.padding,
                      stride=self.stride, bias=False),
            nn.ReLU(inplace=True)
        )
        self.conv3 = nn.Sequential(
            nn.Conv1d(in_channels=32, out_channels=64, kernel_size=self.kernel_size, padding=self.padding,
                      stride=self.stride, bias=False),
            nn.ReLU(inplace=True)
        )
        self.conv4 = nn.Sequential(
            nn.Conv1d(in_channels=64, out_channels=128, kernel_size=self.kernel_size, padding=self.padding,
                      stride=self.stride, bias=False),
            nn.ReLU(inplace=True)
        )
        self.conv5 = nn.Sequential(
            nn.Conv1d(in_channels=128, out_channels=256, kernel_size=self.kernel_size, padding=self.padding,
                      stride=self.stride, bias=False),
            nn.ReLU(inplace=True)
        )

        self.num_conv_layers = 5
        last_conv_layer = self.conv5
        new_input_size = self.calculate_new_width(self.input_size, self.kernel_size, self.padding, self.stride, self.num_conv_layers, max_pooling=None)

        out_channels = last_conv_layer._modules['0'].out_channels
        dimension = out_channels * new_input_size
        self.fc1 = nn.Sequential(
            nn.Linear(in_features=dimension, out_features=3584),
            nn.Dropout(0.5))
        self.fc2 = nn.Sequential(
            nn.Linear(in_features=3584, out_features=1792),
            nn.Dropout(0.5))
        self.fc3 = nn.Sequential(
            nn.Linear(in_features=1792, out_features=448),
            nn.Dropout(0.5))
        self.fc4 = nn.Sequential(
            nn.Linear(in_features=448, out_features=112),
            nn.Dropout(0.5))
        self.fc5 = nn.Sequential(
            nn.Linear(in_features=112, out_features=28),
            nn.Dropout(0.5))
        self.fc6 = nn.Sequential(
            nn.Linear(in_features=28, out_features=6),
            nn.Dropout(0.5))
        self.fc7 = nn.Sequential(
            nn.Linear(in_features=6, out_features=2))

    def forward(self, x):
        x = x.reshape((-1, 1, self.input_size))
        output = self.conv1(x)
        output = self.conv2(output)
        output = self.conv3(output)
        output = self.conv4(output)
        output = self.conv5(output)
        output = output.view(output.size(0), -1)
        output = self.fc1(output)
        output = self.fc2(output)
        output = self.fc3(output)
        output = self.fc4(output)
        output = self.fc5(output)
        output = self.fc6(output)
        output = self.fc7(output)

        return output

    @staticmethod
    def calculate_new_width(input_size, kernel_size, padding, stride, num_conv_layers, max_pooling=2):
        new_input_size = input_size
        for i in range(num_conv_layers):
            new_input_size = ((new_input_size - kernel_size + 2 * padding) // stride) + 1
            if max_pooling is not None:
                new_input_size //= max_pooling
        return new_input_size


class AndroDataset(Dataset):
    def __init__(self, features_as_ndarray, classes_as_ndarray):
        self.features = torch.from_numpy(features_as_ndarray).float().to(device)
        self.classes = torch.from_numpy(classes_as_ndarray).float().to(device)

    def __getitem__(self, index):
        return self.features[index], self.classes[index]

    def __len__(self):
        return len(self.features)


def main():
    start = time()

    global device
    device = torch.device('cuda:0' if torch.cuda.is_available() else 'cpu')
    print('Device: {}'.format(device))
    if torch.cuda.is_available():
        print('GPU Model: {}'.format(torch.cuda.get_device_name(0)))

    csv_data = pd.read_csv('android_binary.csv')
    num_of_features = csv_data.shape[1] - 1
    x = csv_data.iloc[:, :-1].values
    y = csv_data.iloc[:, -1].values
    x_train, x_test, y_train, y_test = train_test_split(x, y, test_size=0.2, random_state=42)

    training_data = AndroDataset(x_train, y_train)
    test_data = AndroDataset(x_test, y_test)

    print('\n~~~~~~~~ TRAINING HAS STARTED ~~~~~~~~')
    print('# of training instances: {}'.format(len(training_data)))

    train_loader = DataLoader(dataset=training_data, batch_size=batch_size, shuffle=True)
    test_loader = DataLoader(dataset=test_data, batch_size=batch_size, shuffle=True)

    model = AndroModel(num_of_features)
    model = model.to(device)

    print('Model Overview:')
    print(model, '\n')

    criterion = nn.CrossEntropyLoss()
    criterion = criterion.to(device)

    optimizer = torch.optim.Adam(model.parameters(), lr=learning_rate)

    losses_in_epochs = []
    # training
    total_step = len(train_loader)  # ayni zamanda VERI/BATCH_SIZE a esit
    for epoch in range(num_epochs):
        losses_in_current_epoch = []
        for i, (features, classes) in enumerate(train_loader):
            features, classes = features.to(device), classes.to(device, dtype=torch.int64)

            optimizer.zero_grad()

            output = model(features)
            loss = criterion(output, classes)
            loss.backward()
            optimizer.step()

            if (i + 1) % log_interval == 0:
                print('Epoch [{}/{}], Step [{}/{}], Loss: {:.4f}'.format(epoch + 1, num_epochs, i + 1, total_step,
                                                                         loss.item()))
                losses_in_current_epoch.append(loss.item())

        avg_loss_current_epoch = 0
        for tmp_loss in losses_in_current_epoch:
            avg_loss_current_epoch += tmp_loss
        avg_loss_current_epoch /= len(losses_in_current_epoch)
        print('End of the epoch #{}, avg. loss: {:.4f}'.format(epoch + 1, avg_loss_current_epoch))
        losses_in_epochs.append(avg_loss_current_epoch)

    print('Average loss: {:.4f}'.format(losses_in_epochs[-1]))
    print(f'Training Duration (in minutes): {(time() - start) / 60}')

    print('\n~~~~~~~~ TEST HAS STARTED ~~~~~~~~')
    print('# of test instances: {}'.format(len(test_data)))
    # test
    accuracy = 0
    with torch.no_grad():
        correct = 0
        for features, classes in test_loader:
            features, classes = features.to(device), classes.to(device, dtype=torch.int64)
            output = model(features)
            output = output.to(device)
            _, predicted = torch.max(output.data, 1)
            correct += (predicted == classes).sum().item()

        accuracy = 100 * correct / len(test_loader.dataset)
        print('Accuracy of the model on the {} test instances: {:.4f} %'.format(len(test_loader.dataset), accuracy))

Do you see and peaks in the GPU usage?
Also, could you just pass random data to your GPU and see, if the utilization increases?
You might also want to time your data loading as shown in the ImageNet example to see, if you have a bottleneck there.

Thanks for your interest. Regarding your question, no, unfortunately have not seen any peaks in the GPU usage. And here are the values of the two average meters as I have used in the same way as it is applied in the ImageNet example that you directed me:

Time  0.025 ( 0.027)
Data  0.000 ( 0.000)

Despite the PyCharm process’s power usage is very high and GPU engine (copy) is used, here is the GPU utilization which is as low as 4%:

That’s strange, since the data loading time seem to be completely hidden behind the computation.
I just tried your code on my machine and simplified it a bit:

  • removed the test loop
  • used random inputs (torch.randn as data and torch.randint as target)
  • used an input batch of [20, 1, 100]

Using this I got a GPU utilization of 97% on a TITAN V GPU.
Does nvidia-smi show any utilization at all?

EDIT: Just saw your second post now.
Could you run nvidia-smi, as I’m not sure how the Windows task manager handles the GPU util and how accurate it is?

1 Like

Of course, here it is:

Thu Jul 04 00:56:34 2019
+-----------------------------------------------------------------------------+
| NVIDIA-SMI 430.86       Driver Version: 430.86       CUDA Version: 10.2     |
|-------------------------------+----------------------+----------------------+
| GPU  Name            TCC/WDDM | Bus-Id        Disp.A | Volatile Uncorr. ECC |
| Fan  Temp  Perf  Pwr:Usage/Cap|         Memory-Usage | GPU-Util  Compute M. |
|===============================+======================+======================|
|   0  GeForce GTX 1070   WDDM  | 00000000:01:00.0  On |                  N/A |
| N/A   68C    P2    99W /  N/A |   2088MiB /  8192MiB |     71%      Default |
+-------------------------------+----------------------+----------------------+

+-----------------------------------------------------------------------------+
| Processes:                                                       GPU Memory |
|  GPU       PID   Type   Process name                             Usage      |
|=============================================================================|
|    0      1384    C+G   Insufficient Permissions                   N/A      |
|    0      3292    C+G   ...hell.Experiences.TextInput.InputApp.exe N/A      |
|    0      3512    C+G   ...a\Local\Vivaldi\Application\vivaldi.exe N/A      |
|    0      3812      C   ...cts\DeepAndroid\venv\Scripts\python.exe N/A      |
|    0      7228    C+G   ... Files (x86)\Dropbox\Client\Dropbox.exe N/A      |
|    0      8260    C+G   ...11411.0_x64__8wekyb3d8bbwe\Video.UI.exe N/A      |
|    0      9068    C+G   Insufficient Permissions                   N/A      |
|    0      9244    C+G   C:\Windows\explorer.exe                    N/A      |
|    0      9760    C+G   ...5n1h2txyewy\StartMenuExperienceHost.exe N/A      |
|    0     10128    C+G   ...t_cw5n1h2txyewy\ShellExperienceHost.exe N/A      |
|    0     10164    C+G   Insufficient Permissions                   N/A      |
|    0     10804    C+G   ...dows.Cortana_cw5n1h2txyewy\SearchUI.exe N/A      |
|    0     11948    C+G   ...48.51.0_x64__kzf8qxf38zg5c\SkypeApp.exe N/A      |
|    0     11972    C+G   ....410.0_x64__8wekyb3d8bbwe\YourPhone.exe N/A      |
|    0     12332    C+G   ...DIA GeForce Experience\NVIDIA Share.exe N/A      |
|    0     18804    C+G   ....28.0_x64__8wekyb3d8bbwe\Calculator.exe N/A      |
+-----------------------------------------------------------------------------+

Thanks!
That looks indeed better with 71%. :slight_smile:

Thank you very much! :clap: Finally, I’d like to ask a couple of questions if you do not mind:

  • Is there a GUI to monitor this?
  • Why is the GPU memory usage for my process (the process with PID 3812) N/A?
  • Why is the type of my process C while others are C+G?
  • I’m not sure, but Windows might have some GUIs for it. Since I’m using Ubuntu, I’m, used to these beautiful black terminals :smiley:
  • Might be some kind of permission issue. Could you try to run the process as an admin and see, if that helps?
  • G = graphics, C = compute. Since you are using CUDA, only C should be shown. As far as I know G will pop up, if e.g. DirectX is used (but I have really limited knowledge about this area).
1 Like

Thank you very much, again, for your great contribution, much appreciated. :clap: Cannot agree more, Terminal is the most missing part of not using Linux. :slightly_smiling_face:

1 Like

p.s. Running the process as the admin(istrator) did not help to see the GPU memory usage of the process. A small note to the potential readers of the topic.

One thing that could help is to use the small arrow right before one of the graphs (such as video encode) and change it to Compute_0 or CUDA or some other similar name there may be in your system. The result should be similar to:

3 Likes

That is really helpful and exactly what I was looking for, thank you very much for your contribution. :clap: @fireis

Glad to help!
One addition, if you want something fancier, there is a commercial (but free) tool called MSI Afterburner which is able to provide more info, such as temperature and power usage.

1 Like

Why is the GPU memory usage for my process (the process with PID 3812 ) N/A ?

Maybe if you open CMD as administrator and run nvidia-smi, then it could give you more information since you have more privileges.

It is still the same, unfortunately.

It seems that it is not possible to see the GPU memory usage with nvidia-smi while you have a display connected to the GPU in Windows, according to this Stack Overflow answer: https://stackoverflow.com/a/44228331

Another option seems to be an API (https://developer.nvidia.com/nvapi) that lets you see GPU info on Windows, but I have not tried since I work on Ubuntu.

As a last resort, you could come to Linux, we have penguins and cookies! :cookie: :penguin: