I am attempting to use my fine-tuned DistilBERT model to extract the embedding of the ‘[CLS]’ token. For every row in my dataset I want to extract this feature and return the result into an array.
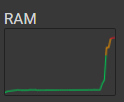
However, my code seems to be suffering from a memory leak. I have roughly ~14K rows in my dataset and by the time the code has finished executing, Google Colab has either crashed or reports that I have used almost all 25GB of RAM!
Each embedding is a tensor with 768 elements. So for 14K elements, the returned array should be on the order of 20-30 MBs.
Here is my function that is failing from the memory leak:
def getPooledOutputs(model, encoded_dataset, batch_size = 128):
  pooled_outputs = []
  print("total number of iters ", len(encoded_dataset['input_ids'])//batch_size + 1)

  for i in range(len(encoded_dataset['input_ids'])//batch_size + 1):
    up_to = i*batch_size + batch_size

    if len(encoded_dataset['input_ids']) < up_to:
      up_to = len(encoded_dataset['input_ids'])

    input_ids = th.LongTensor(encoded_dataset['input_ids'][i*batch_size:up_to])
    attention_mask = th.LongTensor(encoded_dataset['attention_mask'][i*batch_size:up_to])
    with torch.no_grad():
      embeddings = model.forward(input_ids=input_ids, attention_mask=attention_mask, output_hidden_states=True)['hidden_states'][-1][:,0] # Pooled output
      pooled_outputs.extend(embeddings)

  return pooled_outputs