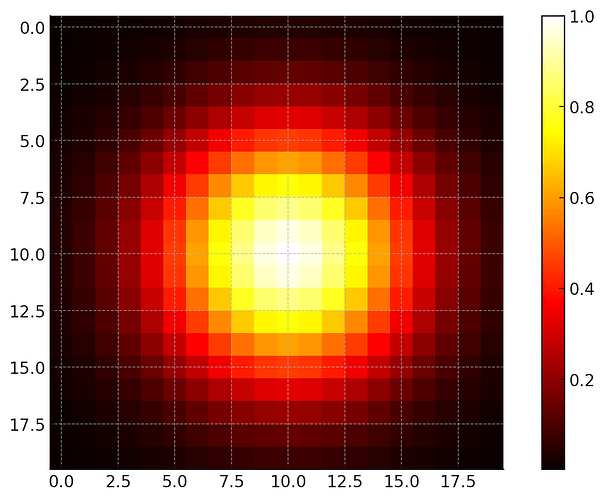
Could you help with a code that creates a heatmap with highest intensity at the key point and the intensity fades in all directions follow a guassian distribution with a standard deviation of 4
import torch
import matplotlib.pyplot as plt

def gaussian_heatmap(height, width, center, std_dev=4):
    """
    Args:
    - height (int): Height of the heatmap.
    - width (int): Width of the heatmap.
    - center (tuple): The (x, y) coordinates of the Gaussian peak.
    - std_dev (int, optional): Standard deviation of the Gaussian.

    """
    x_axis = torch.arange(width).float() - center[0]
    y_axis = torch.arange(height).float() - center[1]
    x, y = torch.meshgrid(x_axis, y_axis, indexing='ij')

    return  torch.exp(-((x ** 2 + y ** 2) / (2 * std_dev ** 2)))

height, width = 20, 20
center = (10, 10)

heatmap = gaussian_heatmap(height, width, center)
plt.imshow(heatmap, cmap='hot', interpolation='nearest')
plt.colorbar()
plt.show()
Thanks, i have the image key points and their cordinates in a json file. I should be able to have this heat map on each point shown on the image. Then the center cordinated returned and distances between these cordinates calculated.
How can i have it imposed on the key points. Can each point have different centre colour intensity that fades to zero instead of having different colours.
