I’m trying to train two nets simultaneously on my machine. When starting the second training script, I got this strange error
RuntimeError: CUDA out of memory. Tried to allocate 136.00 MiB (GPU 0; 12.00 GiB total capacity; 4.51 GiB already allocated; 130.87 MiB free; 164.77 MiB cached)
If I have 12.00 GiB total, and 4.51 GiB allocated, I should have 7.49 GiB free. Then why does allocating merely 136 MiB exhaust the memory? 136 MiB < 7.49 GiB
Also the size of my model checkpoint is less thank 200 MB. What’s a good way to figure out why I’m using up this memory?
After printing torch.cuda.memory_allocated(device)/1e9 after every .to(device) call in my script, I’m seeing that everything remains under 0.4 until I call my net.forward() at which time I get the error, so I think you are right.
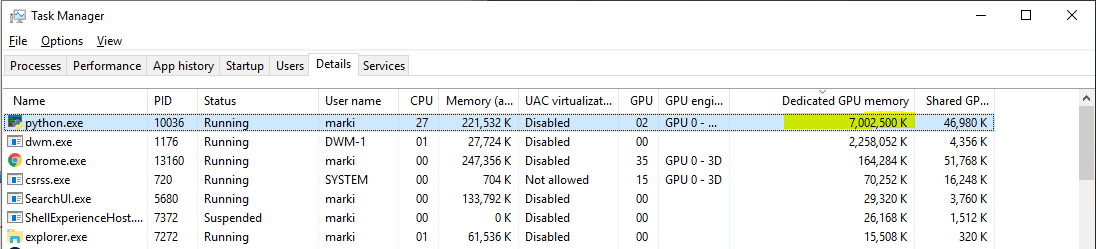
This would imply about a 20x overhead on top of just the weights + net input to reach the 7 gigs reported by task manager. This is surprising that the overhead would be that large.
But back to my original question, I had a thought on why the numbers do not add up. When saying already allocated, the error must only be reporting only the amount allocated by the current process, not the amount of GPU memory allocated period.
correct me if I am wrong. I think the large amount of GPU memory is used up by the training data, the network parameters are those comparisonly small to the data loaded to GPU memory for training.
you might try to reduce the batch size by half and see whether this situation improve?
I’m not familiar with the Windows task manager output, but it will most likely also show the cached memory (which is allocated by PyTorch and can be reused).
The overhead depends also on the layer type.
E.g. convolution layers have a small memory footprint regarding their parameters, but a larger memory usage regarding the output volumes.
This conv layer will just use 9 FP32 parameters, which is tiny:
However, if we feed an input of [10, 1, 224, 224] to this layer, the output will have the same shape as the input and thus we double the memory usage.
Usually the number of output channels might be even larger, so depending on your model architecture, the overhead is expected.