I try to profile the text detection model from GitHub - ymy-k/DPText-DETR: DPText-DETR: Towards Better Scene Text Detection with Dynamic Points in Transformer (AAAI 2023) using torch.profiler
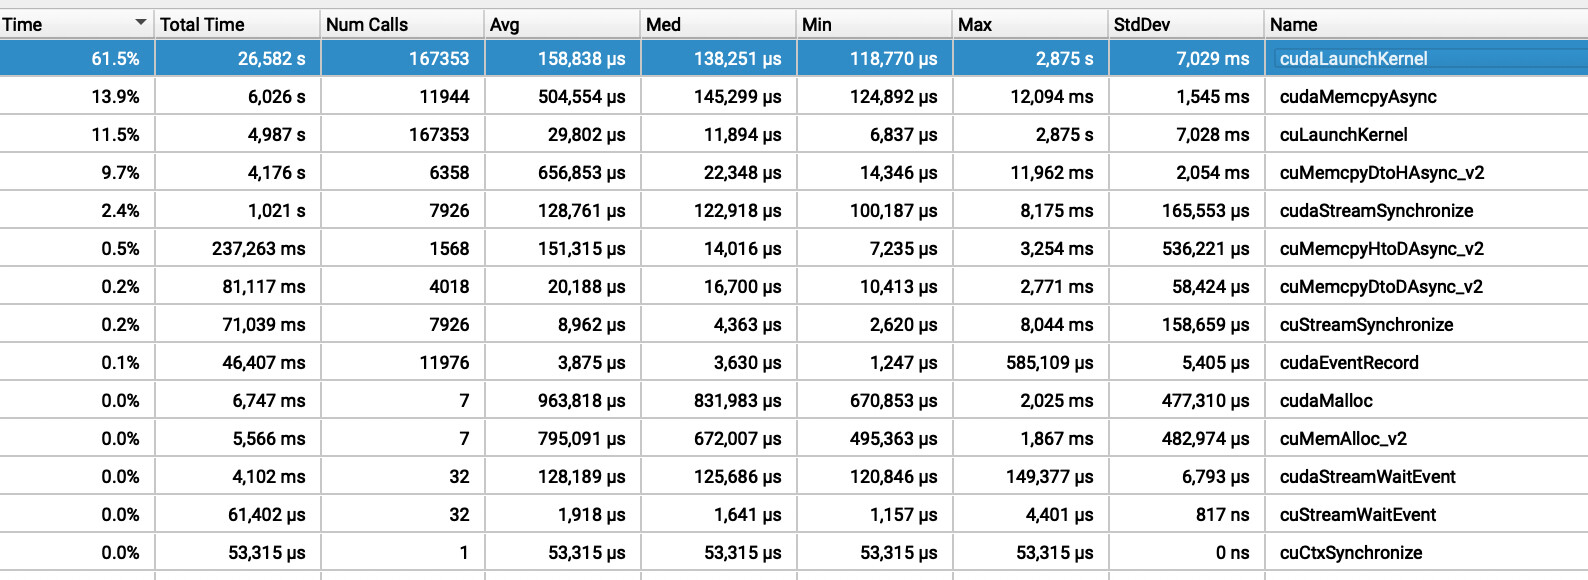
According to the results cudaLaunchKernel takes 99.19% of CPU time.
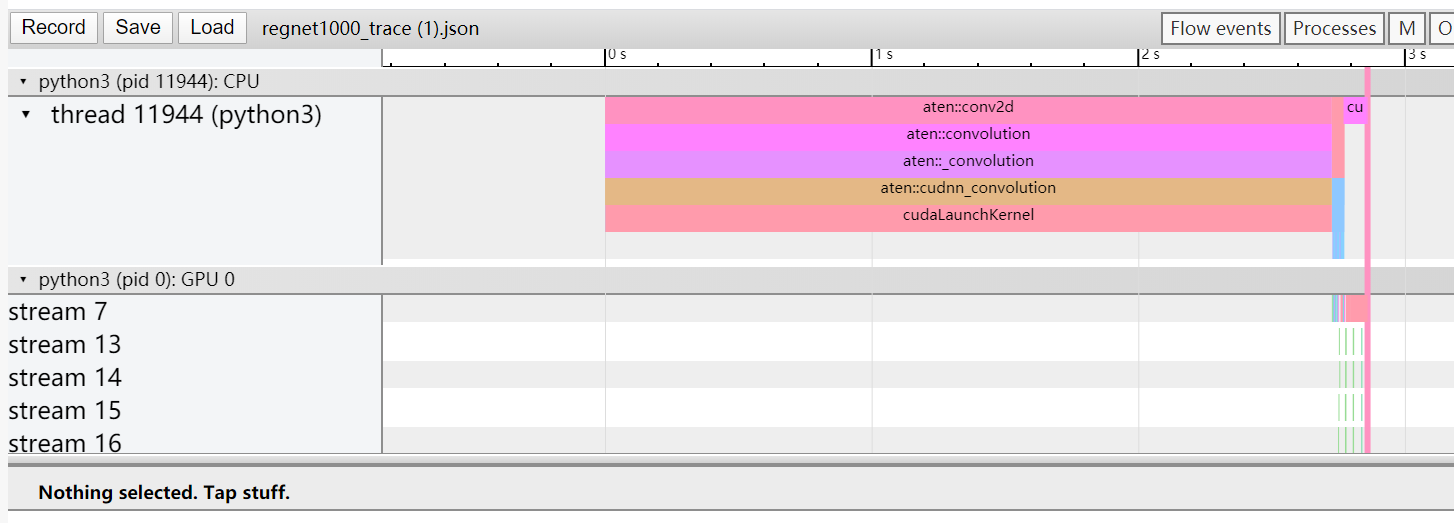
I tried to use other non-Pytorch-related profilers, that shows that this part is the one to consume the most part of the time.
    def gen_encoder_output_proposals(self, memory, memory_padding_mask, spatial_shapes):
        N_, S_, C_ = memory.shape
        base_scale = 4.0
        proposals = []
        _cur = 0
        for lvl, (H_, W_) in enumerate(spatial_shapes):
            mask_flatten_ = memory_padding_mask[:, _cur:(_cur + H_ * W_)].view(N_, H_, W_, 1)
            valid_H = torch.sum(~mask_flatten_[:, :, 0, 0], 1)
            valid_W = torch.sum(~mask_flatten_[:, 0, :, 0], 1)

            grid_y, grid_x = torch.meshgrid(torch.linspace(0, H_ - 1, H_, dtype=torch.float32, device=memory.device),
                                            torch.linspace(0, W_ - 1, W_, dtype=torch.float32, device=memory.device))
            grid = torch.cat([grid_x.unsqueeze(-1), grid_y.unsqueeze(-1)], -1)

            scale = torch.cat([valid_W.unsqueeze(-1), valid_H.unsqueeze(-1)], 1).view(N_, 1, 1, 2)
            grid = (grid.unsqueeze(0).expand(N_, -1, -1, -1) + 0.5) / scale
            wh = torch.ones_like(grid) * 0.05 * (2.0 ** lvl)
            proposal = torch.cat((grid, wh), -1).view(N_, -1, 4)
            proposals.append(proposal)
            _cur += (H_ * W_)
        output_proposals = torch.cat(proposals, 1)
        output_proposals_valid = ((output_proposals > 0.01) & (output_proposals < 0.99)).all(-1, keepdim=True)
        output_proposals = torch.log(output_proposals / (1 - output_proposals))
        output_proposals = output_proposals.masked_fill(memory_padding_mask.unsqueeze(-1), float('inf'))
        output_proposals = output_proposals.masked_fill(~output_proposals_valid, float('inf'))

        output_memory = memory
        output_memory = output_memory.masked_fill(memory_padding_mask.unsqueeze(-1), float(0))
        output_memory = output_memory.masked_fill(~output_proposals_valid, float(0))
        output_memory = self.enc_output_norm(self.enc_output(output_memory))
        return output_memory,
So, I tried to play around this part, creating some random tensors like this:
memory = torch.randn([1, shape, 256], device = 'cuda')
memory_padding_mask = torch.randn([1, shape], device = 'cuda') > 0.5
spatial_shapes = torch.randint(16, 224, [4, 2], device = 'cuda')
spatial_shapes = torch.tensor([[125, 125],
        [ 63,  63],
        [ 32,  32],
        [ 16,  16]], device='cuda')
tensors.append((memory, memory_padding_mask, spatial_shapes))

with profile(activities=[ProfilerActivity.CPU, ProfilerActivity.CUDA], with_stack=True,) as prof:
    with record_function("model_inference"):
        for memory, memory_padding_mask, spatial_shapes in tensors:
            r = gen_encoder_output_proposals(memory, memory_padding_mask, spatial_shapes)
And I got the same result. Warming up the model doesn’t help me to improve the performance.
However, if I firstly run it on e.g. tensors[:1] and then I execute the whole loop, I got way better results.
So whether there is a weak part that should be replaced or is it a problem of incorrect profiling?