Custom dataset normalization

Hi I am applying normalization to SceneNet Dataset SceneNet RGB-D: Photorealistic Rendering of 5M Images with Perfect Ground Truth

Like this:

   transform = transforms.Compose([transforms.Resize((192, 256)),
                                        transforms.ToTensor(),
                                        transforms.Normalize(mean=[0.4451, 0.4262, 0.3959],
                                                             std=[0.2411, 0.2403, 0.2466])])

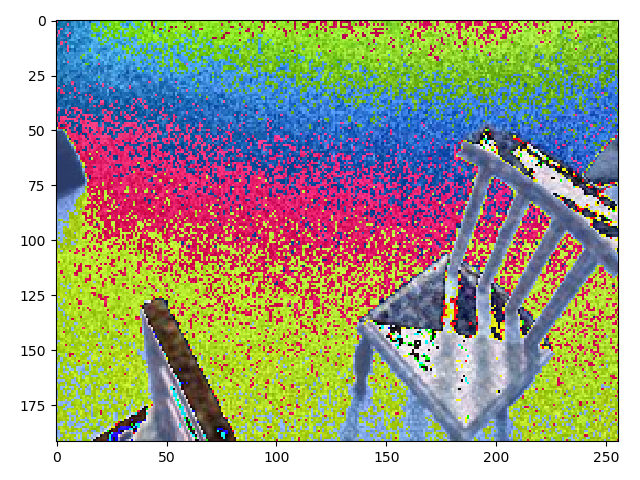
and I am getting images like this one.
image
To calculate the mean and std per channel I used the function “online_mean_and_sd” from here: About Normalization using pre-trained vgg16 networks - #18 by amit_js

is the normalization process correct?

Hi,

Can you please share the way you visualize your images? Even if the std and mean are not correct, these values are near to ImageNet statistics so this kind of image cannot be produced (so strange).

Bests

Here: =)

def imshow(img, title=""):
    transform = transforms.ToPILImage()
    img = transform(img)
    plt.title(title)
    plt.imshow(img.convert("RGB"))
    plt.show()

Ow, I see, you need to unnormalize images after normalizing them for visualization purposes.

Here is small snippet that does this:

img = img.numpy().transpose((1, 2, 0))
mean = np.array([0.4451, 0.4262, 0.3959])  
std = np.array([0.2411, 0.2403, 0.2466])])
img = std * img + mean
img = np.clip(img*255, 0, 255)
plt.imshow(img)