mathwseg
December 18, 2024, 10:54pm
1
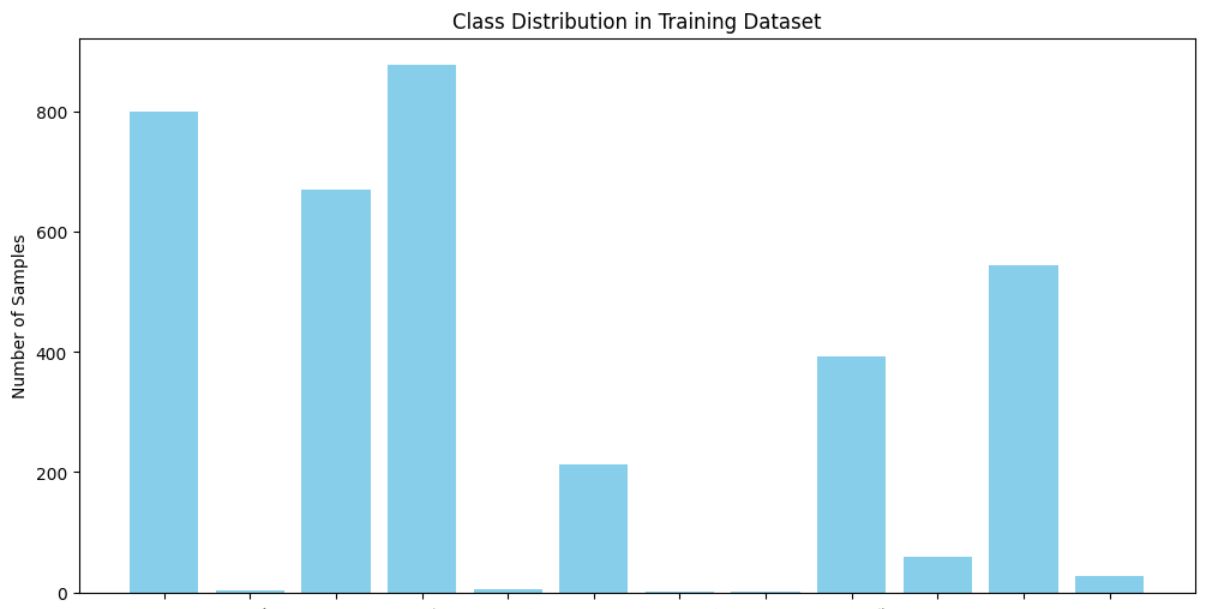
I have an issue in the size of the dataset which is relatively small in some classes as its distribution is not balanced well enough. Although I used augmentation and got the accuracy 93 % but the confusion matrix is very bad in some classes (got zero in precision and recall) . How can i solve this problem. i can drop the classes which causes this issue but i need to try solutions to handle this classes please can someone help me
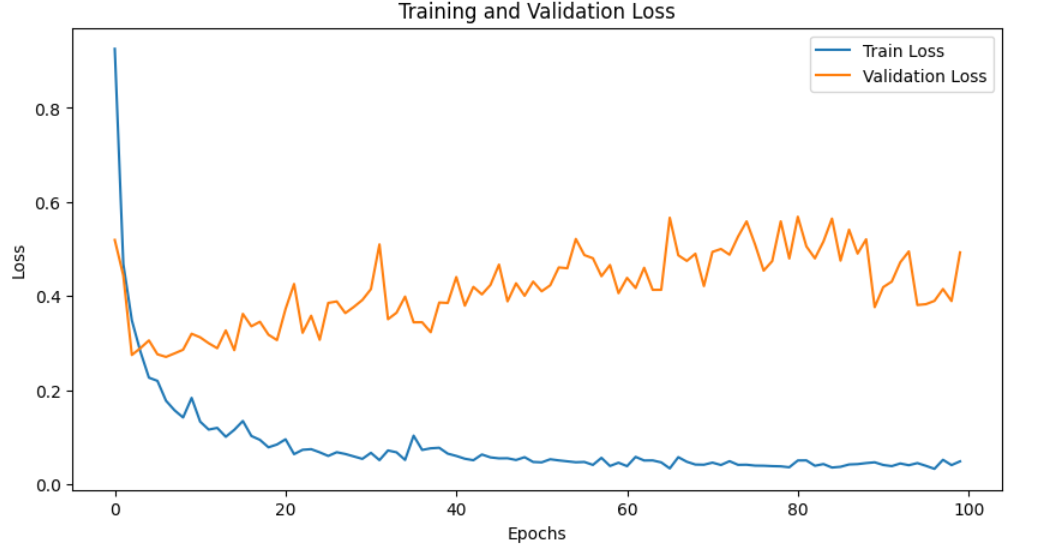
the loss curve like
Accuracy is 93 % from the curve but got average accuracy 0.89 from confusion
What does the distribution in your classes look like?
J_Johnson
December 19, 2024, 4:03am
3
Here is how you can create a weighted vector for scaling the loss of various classes to their representation in the training dataset:
Here is a function for calculating the weight vector used by CrossEntropyLoss based on a set of targets with integers.
def scaled_weights(targets):
'''
Gets class weights
:param targets: pass in the matrix of size (batch, classes) containing correct targets or
labels as one_hot
:return: returns a vector for weight rescaling for use in cross entropy loss function
'''
N, C = targets.size(0), targets.size(1)
# get vector of total for each class
totals = ta…
That gets passed into PyTorch Cross Entropy Loss weight argument.
mathwseg
December 19, 2024, 8:34am
5
i will try it now . Thanks
mathwseg
December 19, 2024, 9:57am
6
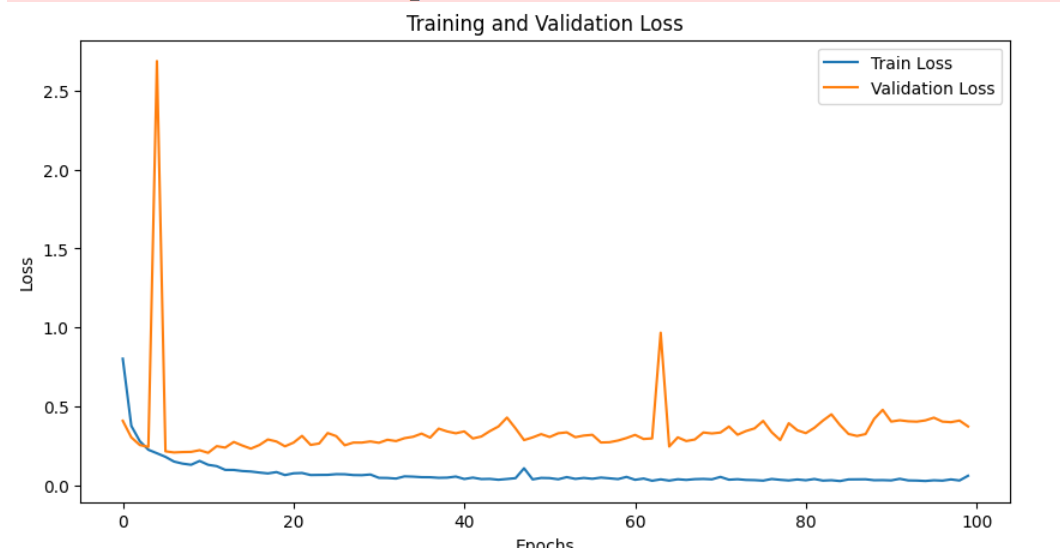
the curve after using scaled weights
accuracy become 93.37 but sill the confusion is bad
i’m using this code to load the .pth file after trained the model
import torch
import numpy as np
from sklearn.metrics import confusion_matrix
import seaborn as sns
import matplotlib.pyplot as plt

# Load the trained model
checkpoint_path = 'checkpoint.pth'
checkpoint = torch.load(checkpoint_path)
model.load_state_dict(checkpoint['model_state_dict'])
model.to(device)
model.eval()

# Evaluate on the validation or test set
y_true = []
y_pred = []

with torch.no_grad():
    for inputs, labels in tqdm(val_loader):
        inputs, labels = inputs.to(device), labels.to(device)
        outputs = model(inputs)
        _, preds = torch.max(outputs, 1)

        y_true.extend(labels.cpu().numpy())
        y_pred.extend(preds.cpu().numpy())

# Compute confusion matrix
conf_matrix = confusion_matrix(y_true, y_pred)

# Plot confusion matrix
plt.figure(figsize=(10, 8))
sns.heatmap(conf_matrix, annot=True, fmt='d', cmap='Blues', xticklabels=classes, yticklabels=classes)
plt.xlabel('Predicted Labels')
plt.ylabel('True Labels')
plt.title('Confusion Matrix')
plt.show()