Dataloader is incredibly slow, what am I doing wrong?

Hi

I’m currently running a small test network, which consist of 378 parameters.
The network is tested on a dataset which consist of 600 points, with 2 features each (points in 2D).
All the data is loaded into the standard pytorch dataloader, and I keep it all on cpu and does not employ nn.dataparallel on my dataloader in this model.

Now the problem comes when I iterate over the dataloader, for some reason this takes more than 99% of the total computational time, I do not apply any data transformation or use any complicated datasampler.
This is what my dataloader looks like:

    train_loader = data.DataLoader(dataset_train_torch, batch_size=args.batch_size, shuffle=True,
                            num_workers=20, pin_memory=True, drop_last=True)

For one training epoch I get timings that looks like this: time_data: 0.0007 time_tot: 6.4737
Where time_tot is the full time for an epoch, and time_data is the time for doing everything after the dataloading. My batch size is 100.

Is the dataloader just not well suited for such small datasets?
Even then how can almost 6.5 s be used just loading the data at each epoch?

Any help would be greatly appreciated.

How are you iterating over the dataloader? Can you post the database? How are you timing? (Realize cuda is asynchronous)

This is my main loop, it is a bit involved

    for epoch in range(args.start_epoch, args.epochs):
        t0 = time.time()
        for i, (samples, target, idxs) in enumerate(train_loader):
            t1 = time.time()
            samples = samples.to(device, non_blocking=True)
            target = target.to(device, non_blocking=True)
            lambd_i = lambd[idxs, :]
            lambd_i = lambd_i.to(device, non_blocking=True)
            idxs = idxs.long()
            adjust_learning_rate(optimizer, epoch, i, len(train_loader), args)

            t2 = time.time()
            uf_i = descriptor(samples)
            u_i = classifier(uf_i)
            t3 = time.time()

            if use_admm_features:
                vf_i = vf[idxs, :]
                vf_i = vf_i.to(device, non_blocking=True)
                v_i = classifier(vf_i)
            else:
                v_i = v[idxs, :].to(device, non_blocking=True)
            labeled_batch_size = target.data.ne(NO_LABEL).sum().item()
            batch_size = len(target)

            misfit_k = misfit_fnc_k(u_i, target) / labeled_batch_size
            misfit_u = rho * misfit_fnc_u(input=u_i, target=v_i, weight=cardinal_weights_u) / batch_size
            lagrange = lagrange_fnc(lambd_i, u_i, v=v_i,rho=rho,weight=cardinal_weights_u) / batch_size
            loss = misfit_k + misfit_u + lagrange

            meters.update('misfit_k', misfit_k, labeled_batch_size)
            meters.update('misfit_u', misfit_u, batch_size)
            meters.update('lagrange', lagrange, batch_size)
            meters.update('time_data', lagrange, batch_size)

            t4 = time.time()
            optimizer.zero_grad()
            loss.backward()
            optimizer.step()
            t5 = time.time()
            meters.update('time_data', t5-t1)
            # print("loader = {:.2E}, rest = {:.2E}".format(t1-t0,t5-t1))
            # t0 = time.time()
        meters.update('time_tot',t5-t0)
        LOG.info('misfit_k: {meters[misfit_k]:.4f} \t'
                 'misfit_u: {meters[misfit_u]:.4f} \t'
                 'lagrange: {meters[lagrange]:.4f} \t'
                 'time_data: {meters[time_data]:.4f} \t'
                 'time_tot: {meters[time_tot]:.4f} \t'.format(meters=meters))
        meters.reset()

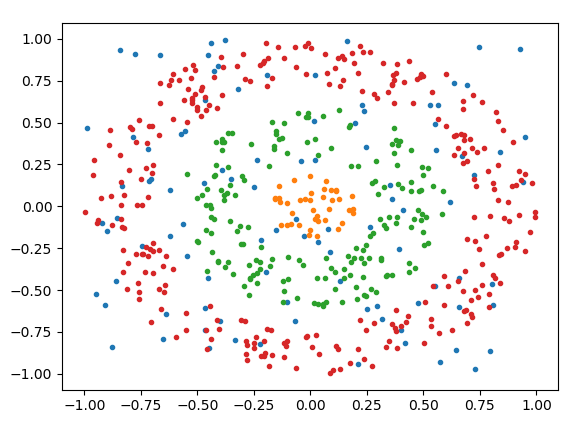
The dataset is litterally just scattered points lying in the 2D plane, so the features are x and y coordinates of each point, and the targets are then either 0,1,2 or -1 for noise.
Here is a visualization of my datapoints, each different class is a different color.
2D

The database is created using this function:

class TensorDataset_custom(data.TensorDataset):
    def __init__(self, samples,targets):
        super(TensorDataset_custom, self).__init__(samples,targets)
        self.targets = targets
        self.samples = samples
        classes = torch.unique(targets)
        self.nclasses = sum(classes.numpy() >= 0)

    def __getitem__(self, index):
        sample = self.samples[index]
        target = self.targets[index]
        return sample, target, index

Regarding timing, I’m currently running everything on cpu in this simple example, so that shouldn’t be an issue

This is weird, I’d expect the timing should be reversed with your very simple dataset but somewhat involved computations on the samples…

I want to point at something that you might have missed: you update the time_data meter with the lagrange variable, before updating it again with t5-t1. How does your meters work? Does it return some average or the last value? This could influence the printed time_data at the end…

Also, do you really need 20 workers for such a small dataset? Have you tried different values?

1 Like

Hi, I think your time_tot reflects the amount of time it needs to process an epoch. I don’t know how meters work but the last timing 'time_tot'=t5-t0 is measuring the amount of time you need to process an epoch as t0 is outside the for loop.

I find it’s difficult to measure the time it takes to load the data but it’s probably really low. Realize you are reading RAM. It may happen (just an hypotesis) that using workers slows dataloading as you are not preprocessing and starting them runs a big bunch of code.

1 Like

Btw I wrapped dataloader into a class just to measure time. I don’t really know if this is ok considering multiprocessing and dataloader’s complexity but it may help:

import torch
from torch.utils.data import Dataset, DataLoader

import time


def timeit(method):
    def timed(*args, **kw):
        ts = time.time()
        result = method(*args, **kw)
        te = time.time()
        if 'log_time' in kw:
            name = kw.get('log_name', method.__name__.upper())
            kw['log_time'][name] = int((te - ts) * 1000)
        else:
            print('%r  %2.2f ms' % \
                  (method.__name__, (te - ts) * 1000))
        return result

    return timed


# class DLtimer(object):
#     def __new__(cls, obj):
#         obj.__next__ = timeit(obj.__next__)
#         return obj
class DLtimer(object):
    def __init__(self, obj):
        self.dataloader = iter(obj)
    def __iter__(self):
        return self
    @timeit
    def __next__(self):
        return next(self.dataloader)


class DS(Dataset):
    def __init__(self):
        self.data = torch.rand(1000, 10)

    def __len__(self):
        return self.data.size(0)

    def __getitem__(self, item):
        return self.data[item]


ds = DS()
train_loader = DataLoader(ds, batch_size=10, shuffle=True,
                          num_workers=0, pin_memory=True, drop_last=True)
train_loader = DLtimer(train_loader)
for i, data in enumerate(train_loader):
    print(i)

The spoiler is using multiprocessing to just read data from ram may be undesirable.

1 Like

I want to point at something that you might have missed: you update the time_data meter with the lagrange variable, before updating it again with t5-t1 . How does your meters work? Does it return some average or the last value? This could influence the printed time_data at the end…

Good catch!, I just fixed that. It did even things out slightly more, but time_tot is still 30 times more than time_data (and that includes the factor 6 for the batch vs epoch).

Also, do you really need 20 workers for such a small dataset? Have you tried different values?

I started out with 2 workers, and just ramped it up when I noticed the delay, but it doesn’t really seem to make any difference.

Hi, I think your time_tot reflects the amount of time it needs to process an epoch. I don’t know how meters work but the last timing 'time_tot'=t5-t0 is measuring the amount of time you need to process an epoch as t0 is outside the for loop.

Yeah the time_tot is the full time for an epoch, while time_data is only the average time for a batch, but in the timings I gave earlier I just manually multiplied the time_data with the number of batches (6 batches), so the numbers should be comparable.

I find it’s difficult to measure the time it takes to load the data but it’s probably really low. Realize you are reading RAM. It may happen (just an hypotesis) that using workers slows dataloading as you are not preprocessing and starting them runs a big bunch of code.

That could be one explanation, can you just straight up disable the workers though? It turns out you can, and as soon as I set the number of workers to 0, the code jumped dramatically in speed, now the code is all time_data!

Nice to know! :slight_smile: I just did that small experiment and, with no preprocesing and reading from RAM, it’s not worth it to use