Dataloaders and Cuda management

Hi,

I am trying to figure out why my GPU is crashing. At first I was passing model and the train/val dataloaders to cuda, and got the message" cuda out of memory".

Now I am passing just the model and every batch in the train loop to cuda.
There is something I don’t understand. At the very beginning of my notebook I run this code:

print(torch.cuda.memory_allocated())
print(torch.cuda.memory_cached())

and get:

1024
2097152

I don’t understand where the 2097152 is coming from.

My training loop is as follows:
1- loop on the train loader and calculate the train loss.
2 -loop on the val loader and calculate the val loss.
3 - call a defined score() function on train loader (that loops train loader and predict using the model)
4 - call a defined score() function on val loader.

Everything works fine until step 3. during the score function I receive this error:

CUDA out of memory. Tried to allocate 20.00 MiB (GPU 0; 4.00 GiB total capacity; 2.61 GiB already allocated; 2.10 MiB free; 354.91 MiB cached)

the memory state at the end of step 2 is:

print(torch.cuda.memory_allocated())
print(torch.cuda.memory_cached())
3274752
48234496

and Finally here’s what im doing inside the score() function:

    predicted = torch.tensor([])
    Y = torch.tensor([])
    for i, (inputs , targets) in enumerate(train_loader):
        inputs, targets = inputs.cuda(), targets.cuda()
        pred = model(inputs)
        pred = pred.cpu()
        predicted = torch.cat((predicted, pred.float()), 0)
        Y = torch.cat((Y, targets.cpu()), 0)
    y_true = Y.numpy()
    y_pred = predicted.detach().numpy()

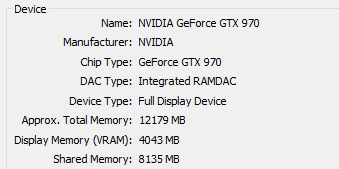
and here’s the GPU I have:
graphics
Any tips to train my models locally ? I really appreciate your help !

At the beginning of the script no memory should be allocated.

import torch
print(torch.cuda.memory_allocated())
> 0
print(torch.cuda.memory_cached())
> 0

In your score function you are storing the computation graphs of each forward pass in predicted.
This will most likely cause the out of memory issue.
The usual work flow would be to calculate the loss for each batch and perform an optimization step.
Could you explain your use case a bit and why you are storing predicted just to detach it afterwards?
If you don’t need to calculate a loss and call backward on it, you should detach pred after calculating it or wrap the loop in a with torch.no_grad() block.

1 Like

Sorry for the late reply! I just realized that

1024
2097152

is coming from these two lines:

pos_weights = class_weight["1"] * torch.ones(1, dtype = torch.float32, device = 'cuda')
neg_weights = class_weight["0"] * torch.ones(1, dtype = torch.float32, device = 'cuda')

Which is weird! it’s just a one element tensor! Can you please explain why this huge difference between cache and allocated memory.

You are right! Not doing detach() on pred was causing the problem. Well apparently I missed the fact that the graphs were saved for backprop on every iteration. Now everything works well.

In score() function I am calculating y_pred, and then return some scores to my training loop ( accuracy, roc-auc, f1 …)

One last question: Now as everything is working well, I re-checked my GPU performance and found that utilization is between 3% and 6% Even when I increase the batchsize to 256 the range is 5% to 20%. Why the GPU is not fully used ?

If I’m not mistaken, cudaMalloc rounds to 2MB blocks in newer GPUs, which is exactly (2097152 / 1024**2), which would explain the minimal cache size.

You might have a data loading bottleneck.
Profile your data loading overhead using the code from the ImageNet example. If you see some overhead in loading the data, check this post from @rwightman, where he explains some possible workarounds.

I will check them out, Thank you!

I read through the posts you shared with me, and many other forum’s questions regarding this issue. I changed my dataloaders to the following:

X_train, X_val, y_train, y_val = train_test_split(X.astype('float32'), Y.astype('float32'), test_size=0.1, random_state=2)
X_train = torch.tensor(X_train)
y_train = torch.tensor(y_train)
train = torch.utils.data.TensorDataset(X_train,y_train)
train_loader = torch.utils.data.DataLoader(train, batch_size = 256, shuffle = True, num_workers= 4, pin_memory= True )

and:

X_val = torch.tensor(X_val)
y_val = torch.tensor(y_val)
val = torch.utils.data.TensorDataset(X_val,y_val)
val_loader = torch.utils.data.DataLoader(val, batch_size =256, shuffle = True, num_workers= 4, pin_memory= True)

here’s my simple train loop:

    for epoch in range(last_epoch, 100):  
        end = time.time()
        for i, (inputs , targets) in enumerate(train_loader):
            inputs , targets = inputs.cuda() , targets.cuda()
            print("train: time for loading batch {} is {}".format(i+1,time.time() - end))
            optimizer.zero_grad()
            outputs = model(inputs)
            loss = criterion(outputs, targets)
            loss.backward()      
            optimizer.step()
            running_loss_train += loss.data.item()
            end = time.time()
        
        end = time.time()
        for i, (inputs , targets) in enumerate(val_loader):
            inputs , targets = inputs.cuda() , targets.cuda()
            print("val: time for loading batch {} is {}".format(i+1,time.time() - end))
            optimizer.zero_grad()
            outputs = model(inputs)
            loss = criterion(outputs, targets)
            loss.backward()      
            optimizer.step()
            running_loss_val += loss.data.item()
            end = time.time()

This resulted in my GPU utilization flactuating between 1% and 34% from the Timing output I think loading the very first batch is causing this bottleneck:

epoch 1
train: time for loading batch 1 is 0.5566799640655518
train: time for loading batch 2 is 0.0019986629486083984
train: time for loading batch 3 is 0.0019989013671875
train: time for loading batch 4 is 0.001997709274291992
train: time for loading batch 5 is 0.0009999275207519531
train: time for loading batch 6 is 0.001999378204345703
train: time for loading batch 7 is 0.0019981861114501953
train: time for loading batch 8 is 0.001999378204345703
train: time for loading batch 9 is 0.0019991397857666016
train: time for loading batch 10 is 0.0019991397857666016
train: time for loading batch 11 is 0.0019991397857666016
train: time for loading batch 12 is 0.001999378204345703
train: time for loading batch 13 is 0.0009996891021728516
train: time for loading batch 14 is 0.001998424530029297
train: time for loading batch 15 is 0.0010004043579101562
train: time for loading batch 16 is 0.0019986629486083984
train: time for loading batch 17 is 0.0010006427764892578
train: time for loading batch 18 is 0.0019989013671875
train: time for loading batch 19 is 0.0019996166229248047
train: time for loading batch 20 is 0.0
val: time for loading batch 1 is 0.4817237854003906
val: time for loading batch 2 is 0.0019991397857666016
val: time for loading batch 3 is 0.0
epoch 2
train: time for loading batch 1 is 0.46173715591430664
train: time for loading batch 2 is 0.0019996166229248047
train: time for loading batch 3 is 0.0019996166229248047
train: time for loading batch 4 is 0.0009996891021728516
.
.
.

Any insights ? PS: I played around with the batch size and the num_workers, but they dont seem to solve the issue!

Here’s another timing using non_blocking=True :

epoch 1
train: time for loading batch 1 is 0.6221673488616943
train: time for loading batch 2 is 0.0
train: time for loading batch 3 is 0.0
train: time for loading batch 4 is 0.0
train: time for loading batch 5 is 0.0009992122650146484
train: time for loading batch 6 is 0.0
train: time for loading batch 7 is 0.0
train: time for loading batch 8 is 0.0
train: time for loading batch 9 is 0.0
train: time for loading batch 10 is 0.0
train: time for loading batch 11 is 0.0
train: time for loading batch 12 is 0.0009992122650146484
train: time for loading batch 13 is 0.0
train: time for loading batch 14 is 0.00099945068359375
train: time for loading batch 15 is 0.0009996891021728516
train: time for loading batch 16 is 0.0
train: time for loading batch 17 is 0.0009992122650146484
train: time for loading batch 18 is 0.0010004043579101562
train: time for loading batch 19 is 0.0
train: time for loading batch 20 is 0.0
val: time for loading batch 1 is 0.46076011657714844
val: time for loading batch 2 is 0.0
val: time for loading batch 3 is 0.0
epoch 2
train: time for loading batch 1 is 0.48410654067993164
train: time for loading batch 2 is 0.00099945068359375
train: time for loading batch 3 is 0.00099945068359375
train: time for loading batch 4 is 0.0
train: time for loading batch 5 is 0.0
The prefetching starts by entering the data loader loop and I’m not sure, if there are easy workarounds.
I played around with creating the iterators manually to force the prefetching manually, but I would consider this a hack. Here is the gist I’ve created, but as I said, it’s not the cleanest way of using the DataLoader.

1 Like

@ilyes @ptrblck There is a size of model + data below which you’re going to have a really hard time utilizing your GPU 100% with the combined overhead of Python, the framework, and getting data to/from the GPU, etc. I’ve seen a number of these sorts of posts where that is an issue.

If you can fit the whole dataset in GPU memory, you don’t have CPU augmentations, you might get some more utilization by preprocessing the data, moving to the GPU, and manually indexing that GPU tensor for the batches instead of using a dataloader.

One other thing, try setting pin_memory=False and see how it compares. I’ve had nothing but issues with it on. Recently re-confirmed looking into another issue. Enabling pin_memory choked up all of my CPU cores with 30-40% utilization in the kernel (some sort of synchronization contention?) .

EDIT: I posted a pretty picture of the CPU usage with pin_memory=True in another thread CPU usage extremely high

1 Like

I ran a few more quick what-if experiments to satisfy my curiosity.

I can achieve the highest GPU utilization on the MNIST demo, and see some expected performance scaling with higher batch size, with num_workers=0 and pin_memory=True … this is a little bit higher than num_workers=0 and pin_memory=False.

Setting pin_memory=True with any number of worker processes > 0 is an absolute disaster that pins all cores at 100%.

2 Likes