Hi all, I have encountered a few strange problems when I get started to use DDP in PyTorch.
Exp. setting
I used 2 NVIDIA GPUs in ONE machine as well as 14 threads on 4 CPUs.
I spawned 2 processes each for a GPU in a program.
Each program just allocates 1+G GMEM.
Questions for help
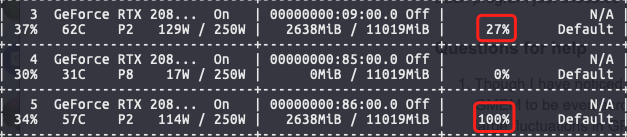
Though I have noticed to use map_location to load state_dict and so on, I found it is good for GMEM to be even across the GPUs and the somewhat strange thing was there were occasionally large fluctuations in GPU utilization, like one is 90+%, the other is ~20%, or the reverse reported. I thought DDP could lead to a more balanced load… Maybe it was because the CPUs were still in need so that the GPUs were far from busy, right?
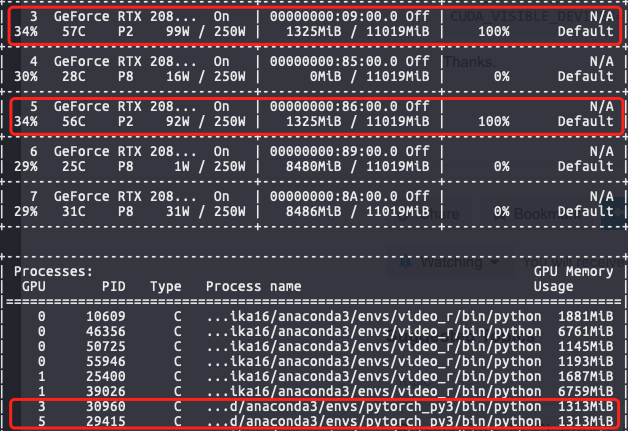
When I was trying to utilize the CPUs, I ran 3 programs on these 2 GPUs. However, it was found to get stuck at a time (in the middle process of training). It appeared to be all 3 programs reduced one of their spawned processes and only left the other on the same GPU. The CPUs were not in use but the GPU utilization shown by nvidia-smi was 100% though it was obvious that the processes were stuck. I am wondering was it the case of a deadlock in that 2 programs were the best practice in the case? (might be somewhat general)
(suspect the stuck is caused by?
val_loss, val_acc = self._run_epoch(...)

dist.barrier()

val_acc = torch.tensor(val_acc).unsqueeze(0).cuda()
out_val_acc = [torch.zeros_like(val_acc) for _ in range(dist.get_world_size())]
dist.all_gather(out_val_acc, val_acc)
val_acc = torch.cat(out_val_acc).mean().item()  # based on the exact division
What are the CPUs used for in your program? It could be possible that if CPUs were busy doing something and not pushing compute to GPUs, the GPU utilization might drop.
I’m not sure I followed this completely, could you elaborate? What are these 3 programs running? Are you running DDP in 3 processes but across 2 GPUs? In general if GPUs are stuck at 100% util it probably indicates an issue where a NCCL collective op is stuck.
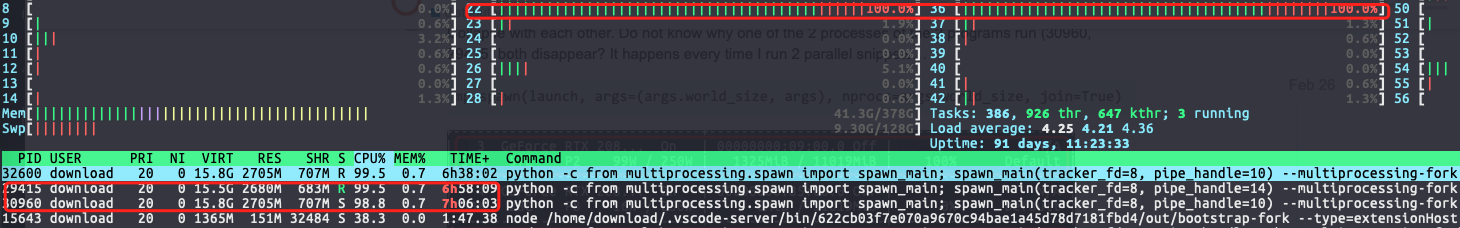
Collapse with each other. Do not know why one of the 2 processes of the 2 programs run (30960, 29415) both disappear? It happens every time I run 2 parallel snippets…
If using multiple processes per machine with nccl backend, each process must have exclusive access to every GPU it uses, as sharing GPUs between processes can result in deadlocks.
I am just reporting what I figured out for who is encountering the similar problem to refer to. In my case, it is the inconsistency caused by lr_scheduler that one process exits normally (in the logic of the program) leaving the other hanging up to wait. So it just seems to get stuck… However, I would still like to use just one NCCL backbend in a GPU as a suggested practice.
Apart from running DDP are the GPUs doing any other processing? If not, what sort of processing are the 14 CPU threads doing? Are the CPU threads responsible for loading data onto the GPU?
Tools like nvidia’s visual profiler might help in getting a better understanding of what exactly is happening on the GPU: Profiler :: CUDA Toolkit Documentation.
No, they do not. I think the CPUs were mainly working on image I/O loading and pre-processing (including data augmentation). But I found even if CPUs were not fully occupying all of the 14 threads (some are not 100% though htop), it often happened that one GPU util (either) is ~90%, the other is ~20% and reversed in a few second. I will take a look at the visual profiler. Thanks for the recommendation.